ch13 - Vanderbilt Business School
11/28/10
CHAPTER 13: DIRECT PRICE DISCRIMINATION 145
I.
INTRODUCTION
This is Luke Froeb, author with Brian McCann of Managerial Economics: a problem-solving approach, and this short video is designed to accompany chapter
13, “Direct Price Discrimination.”
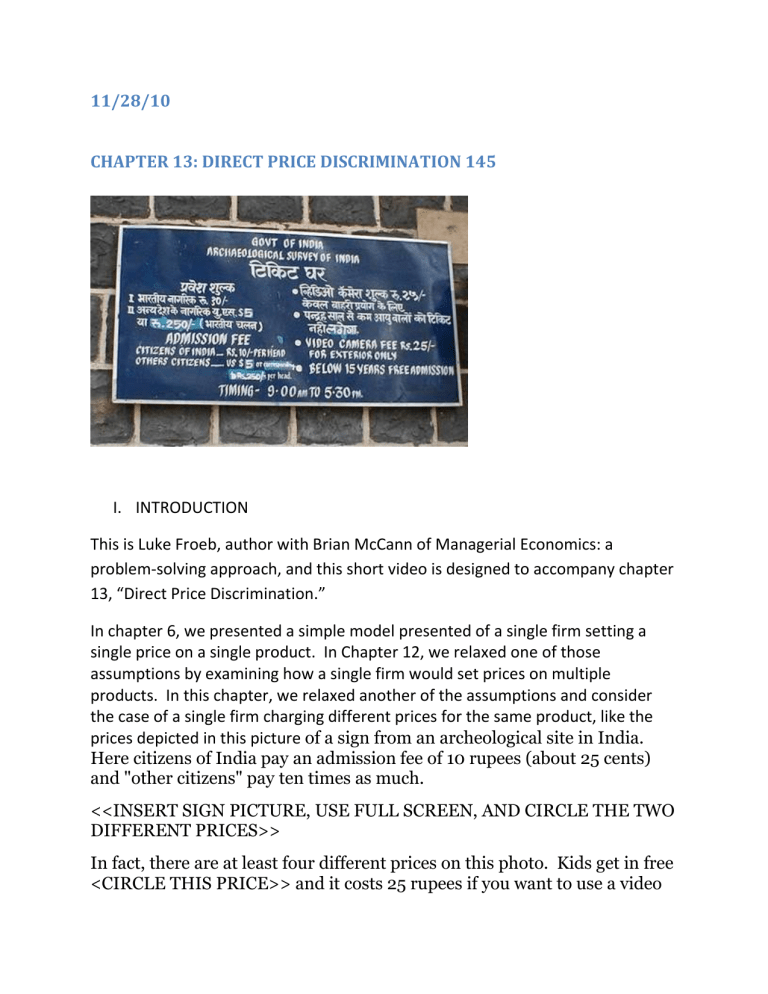
In chapter 6, we presented a simple model presented of a single firm setting a single price on a single product. In Chapter 12, we relaxed one of those assumptions by examining how a single firm would set prices on multiple products. In this chapter, we relaxed another of the assumptions and consider the case of a single firm charging different prices for the same product, like the prices depicted in this picture of a sign from an archeological site in India.
Here citizens of India pay an admission fee of 10 rupees (about 25 cents) and "other citizens" pay ten times as much.
<<INSERT SIGN PICTURE, USE FULL SCREEN, AND CIRCLE THE TWO
DIFFERENT PRICES>>
In fact, there are at least four different prices on this photo. Kids get in free
<CIRCLE THIS PRICE>> and it costs 25 rupees if you want to use a video
camera <<CIRCLE THIS PRICE>>. This picture is taken from Mark
Perry’s terrific blog, Carpe Diem.
I.
WHY DISCRIMINATE?
To see why this kind of pricing is profitable, let’s return to the simple pricing example from Chapter 6, where we constructed a demand curve from ten different consumers who placed different values on an item. We constructed a demand curve by lining them up, from the highest value to the lowest value, and then used marginal analysis to determine how many to sell, or equivalently which price to charge. <<SIMPLY RERUN THE
CLIP FROM CHAPTER SIX WHERE WE SHOWED THAT THE OPTIMAL
PRICE WAS $7 and at the optimal price the firm sold 4 units.>>
Price
$10
$9
$8
$7
$6
$5
$4
$3
$2
$1
Quantiity Revenue MR
1
2
$10
$18
5
6
3
4
$24
$28
$30
$30
9
10
7
8
$28
$24
$18
$10
$10
$8
$6
$4
$2
$0
($2)
($4)
($6)
($8)
MC
$3.50
$3.50
$3.50
$3.50
$3.50
$3.50
$3.50
$3.50
Profit
$6.50
$11.00
$13.50
$14.00
$12.50
$9.00
$3.50
-$4.00
$3.50
-$13.50
$3.50
-$25.00
Notice that at the best price of $7 <<HIGHLIGHT THIS ROW>>, there are still three consumers—those with values of $6, $5 and $4 <<HIGHLIGHT
THESE ROWS>> willing to pay more than the marginal cost of the good. If we could (1) identify these consumers, and (2) figure out a way to charge them a separate price, and (3) prevent them from re-selling to the high value consumers who were buying at $7, then we could construct a second demand curve, and set a second price.
In the table below, we compute the most profitable price for the low value consumers. We use marginal analysis to show that we could profitably sell two extra goods at a price of $5 to these low value consumers and earn an extra $3 in profit.
Price
$6
$5
$4
$3
$2
$1
Quantiity Revenue MR
1 $6
2
3
4
5
6
$10
$12
$12
$10
$6
$6
$4
$2
$0
MC
$3.50
$3.50
$3.50
$3.50
Profit
$2.50
$3.00
$1.50
-$2.00
($2) $3.50
-$7.50
($4) $3.50
-$15.00
<<ILLUSTRATE the EXTRA SALES BY HIGHLIGHTING THE
RELEVANT ROWS>>. By price discriminating, or by reducing the price to the low-value consumers, we can make more money.
Now, let’s get concrete and imagine that these low value customers are all over 65 years of age. And imagine that this is a movie theatre and that the second lower price is offered as a discount to senior citizens. This price discrimination scheme allows us to identify the low value customers by making them present proof that they are over 65, and you prevent them from re-selling their tickets outside the movie theatre by checking the age of anyone using a discounted ticket.
II.
WHAT EXACTLY IS PRICE DISCRIMINATION?
Any time a firm has two different types of consumers, with different elasticities of demand, and it <<LIST “3 CONDITIONS FOR DIRECT PRICE
DISCRIMINATION” IN A LIST>> (1) can identify them, (2) charge different prices to each group, and (3) prevent the low-price group from re-selling to the high-price group, then it becomes profitable to discriminate.
Recall from chapter six, that the optimal price is where MR=MC, which is equivalent to (P-MC)/P=1/|elasticity|. We called the left side of the equation the
“actual margin”, and the right side of the equation the “desired margin.”
So imagine that one group of consumers has a price elasticity of demand equal to
-2 which implies a desired margin of 50% and the other has a price elasticity of demand equal to -3 which implies a desired margin of 33%. If your marginal cost is $4, then set of prices of $8 and $6 to the two groups.
<<SHOW EQUATIONS ($8-$4)/$8=1/|2| “for the low elasticity group”>>
<<SHOW EQUATIONS ($6-$4)/$6=1/|3| “for the high elasticity group”>>
And this makes intuitive sense: charge a higher price to the group that is less sensitive to price and a lower price to the group that is more sensitive to price.
So price discrimination is the practice of charging different prices to different consumers based on differences in demand, not on differences in marginal costs.
However, sometimes it is difficult to tell what is causing the difference.
One example is airline fares. Business travelers and leisure travelers have very different demands. Business travelers want to fly at very specific times, e.g., “I have to be in Cleveland on July 18, at 10am” whereas leisure travelers are more flexible about time and destination. In other words, leisure travelers have more substitutes. But perhaps the biggest difference is that business travelers do not pay for their own tickets; instead, the company pays for their travel. Both of these factors make business demand less elastic than leisure demand, so it makes sense that business travelers pay more for airline tickets than leisure travelers.
However, some of the price difference between business and leisure travelers may be driven by the higher cost of serving business customers. Business meetings are scheduled and cancelled at the last minute, so serving business demand often means that seats go unsold. These unsold seats are costly, so the marginal cost of selling business seats is higher than the marginal cost of selling leisure seats. So there may be a cost element that could explain some of the price difference between business and leisure fares. But even with higher marginal costs, if margins are higher for business travel, then prices are determined, at least in part, by differences in demand elasticities, which is price discrimination.
III.
IMPLEMENTING PRICE DISCRIMINATION SCHEMES
Once you understand how price discrimination works, you will start to notice examples all around you. For example, most business schools offer financial aid to students with stronger academic records. These students typically have more options than weaker students, which is just another way of saying that they have
more substitutes, which makes their demand more elastic. As a consequence, most schools reduce the price of tuition for these students. Financial aid is the way they charge different prices to different students based on differences in demand.
Another example comes from the Indian archaeological site. As in many places around the world, tourists are often charged higher prices than locals, because they have less elastic demands. This may be due to higher income or it may also be due to the better information of locals: they are more likely to be aware of lower-priced substitutes which tends to make their demand more elastic.
In the sign, there are also discounts for children and a premium for using a video camera. Families with children probably have more elastic demand due to less disposable income, so this is likely a price discrimination scheme; and consumers who want to use video cameras probably have less elastic demands because they are likely to have higher incomes.
Drug companies charge higher prices to consumers living in higher income countries. This creates incentives for consumers to travel to lower income countries to buy drugs and bring them back. In the US, older consumers, who typically consume more drugs, will sometimes travel on busses to Mexico to buy drugs and bring them back to the US for consumption. This is called a “grey market” as opposed to a “black market” because it violates company policy, not necessarily a country’s law. <<GRAPHIC OF OLD PEOPLE ON BUSSES TRAVELLING
TO MEXICO TO BUY DRUGS AND BRING BACK?>> If enough consumers do this, they reduce the incentive of companies to discriminate. So many drugs sold in
Mexico end up in the US that the drug companies have raised prices to Mexican consumers.
If you are going to price discriminate, it is usually best to keep the practice as secret because no one likes to pay higher prices than someone else. In fact, if consumers become aware that others are getting better prices, they may even refuse to purchase.
Now that we have taught you how to discriminate, I want to warn you that in many parts of the world, price discrimination is illegal. In the US, it is illegal to price discriminate if you are selling intermediate goods (to another business).
Price discrimination in services and to final consumers is OK. It is also OK to reduce price in order to respond to competition.
IV.
Competition and Price Discrimination
Thus far, we have been talking about price discrimination by a single firm, which prices high to consumers with less elastic demands and prices low to consumers with more elastic demands. But what happens when competitors enter a market? While the empirical evidence is mixed, a competitor would find it relatively easy, and very profitable, to sell to the consumers who are paying the higher prices or being discriminated against.
In the graph below, taken from an article written by Kristopher Gerardi and Adam
Shapir, we see the dispersion of prices charged by United Airlines on its
Philadelphia to Chicago route. Airlines sell tickets at many different prices, and the distribution of prices is plotted against time from 1993 to 2006. Each line represents a different “decile” of the price distribution. The bottom most line represents the lowest 10% of prices, sold primarily to leisure travelers who buy two weeks in advance, stay over a Saturday night, and fly at unpopular times. The highest line represents the 10% most expensive tickets, which are sold primarily to business travelers with no advance purchase, travelling at popular times.
The interesting thing about the graph is that the price dispersion collapses following the entry of low cost airlines. Before Midway entered the route in
1994, United ticket prices ranged from $100-$300. After Midway entered, denoted by green dots, average ticket prices declined, which is what you would expect with more competition, but the range of prices also declined: to between
$75-$150. <<POINT TO THE GREEN DOTS>>
Following the entry of Southwest in 2005, denoted by pink dots, <<POINT TO PINK
DOTS>> you see a similar collapse in the spread of United’s pricing from between
$150-300 to between $90-$150. In this industry at least, it appears that price discrimination becomes much harder when competitors enter the market.
Curiously, entry by ATA (denoted blue dots) <<POINT TO BLUE DOTS>> had a much smaller effect on United prices than Midway or Southwest entry.
Perhaps they were not as strong of a competitor or entered only with a limited number of flights per day.
