03Jun2014
advertisement
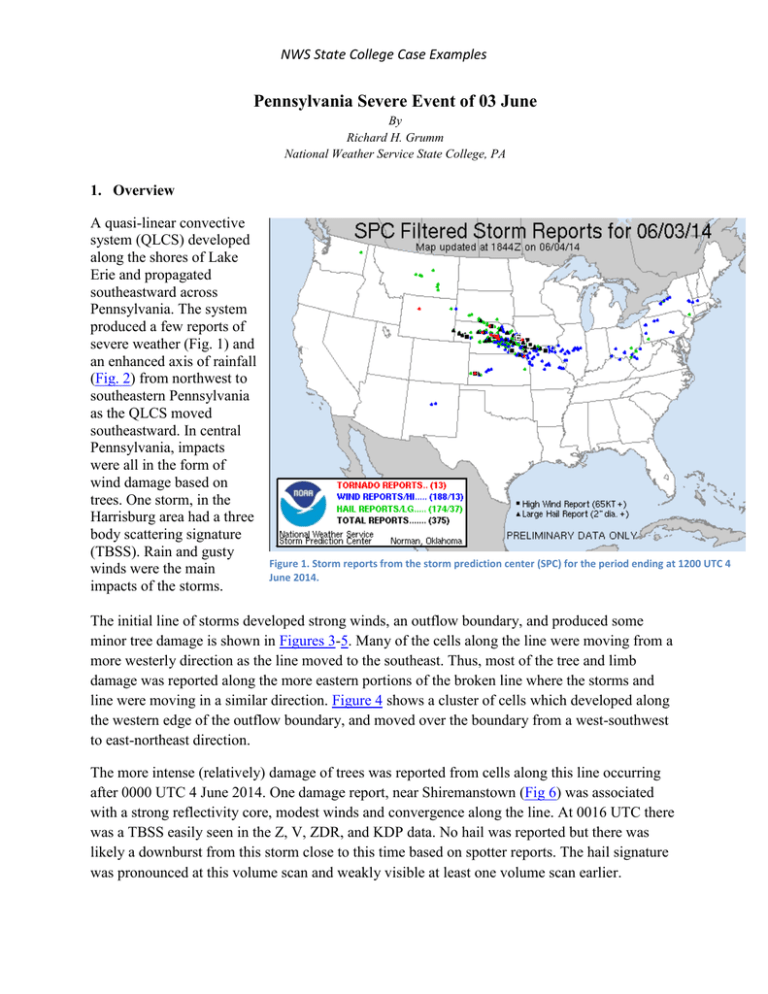
NWS State College Case Examples Pennsylvania Severe Event of 03 June By Richard H. Grumm National Weather Service State College, PA 1. Overview A quasi-linear convective system (QLCS) developed along the shores of Lake Erie and propagated southeastward across Pennsylvania. The system produced a few reports of severe weather (Fig. 1) and an enhanced axis of rainfall (Fig. 2) from northwest to southeastern Pennsylvania as the QLCS moved southeastward. In central Pennsylvania, impacts were all in the form of wind damage based on trees. One storm, in the Harrisburg area had a three body scattering signature (TBSS). Rain and gusty winds were the main impacts of the storms. Figure 1. Storm reports from the storm prediction center (SPC) for the period ending at 1200 UTC 4 June 2014. The initial line of storms developed strong winds, an outflow boundary, and produced some minor tree damage is shown in Figures 3-5. Many of the cells along the line were moving from a more westerly direction as the line moved to the southeast. Thus, most of the tree and limb damage was reported along the more eastern portions of the broken line where the storms and line were moving in a similar direction. Figure 4 shows a cluster of cells which developed along the western edge of the outflow boundary, and moved over the boundary from a west-southwest to east-northeast direction. The more intense (relatively) damage of trees was reported from cells along this line occurring after 0000 UTC 4 June 2014. One damage report, near Shiremanstown (Fig 6) was associated with a strong reflectivity core, modest winds and convergence along the line. At 0016 UTC there was a TBSS easily seen in the Z, V, ZDR, and KDP data. No hail was reported but there was likely a downburst from this storm close to this time based on spotter reports. The hail signature was pronounced at this volume scan and weakly visible at least one volume scan earlier. NWS State College Case Examples The York Haven storm may have been too far from both KCCX and KLWX radars to see any significant features associated with what was described as a potential wet microburst. Overall, a minor thunderstorm event was observed on 3-4 June 2014. The best signals on radar indicated severe potential early in the event was the strong velocity data in the 40 to 55 kts range in central areas. The minor tree damage was focused on the eastern side of the line. Farther south some more pronounced tree and wind damage was observed, likely from a downburst along the line. The storm near Shiremanstown showed some signal as the potential for a severe storm, albeit briefly around 0016 UTC. Figure 2. Stage-IV rainfall over Pennsylvania for the period of 1800 UTC 03 to 0600 UTC 4 June 2014. Arrow parallels the rain area associated with the storms which developed along the lakes and moved into southeastern Pennsylvania, Maryland and New Jersey. Return to text. NWS State College Case Examples Figure 3. KCCX radar showing the line of cells at 1915 and 2034 UTC 3 June 2014. The pronounced outflow boundary was visible by 2030 UTC and is shown here at 20345 UTC The yellow line is drawn just ahead of it. Return to text. NWS State College Case Examples Figure 4. As in Figure 3 except at 2125 and 2218 UTC. Yellow arrow shows movement of new cells pointed by the red arrow over the outflow boundary. The cells to the east were moving with the more westerly flow of both the line and the outflow relative to these cells. Return to text. NWS State College Case Examples Figure 5. Four panel showing 0.5 degree Z, V, ZDR, and CC at 2010 UTC. At this time peak winds in the velocity were over 50kts. The higher ZDR values were displaced forward of (southeast) of the higher reflectivity cores as rain drops were likely pushed to the south and east due to the strong shear in these forward tilted storms. Return to text. NWS State College Case Examples Figure 6. GR2analysis 4 panels of 0.5 degree Z, V, ZDR, and KDP at 0016 UTC 3 June 2014. Return to text.

