The Hertzsprung-Russell Diagram
advertisement
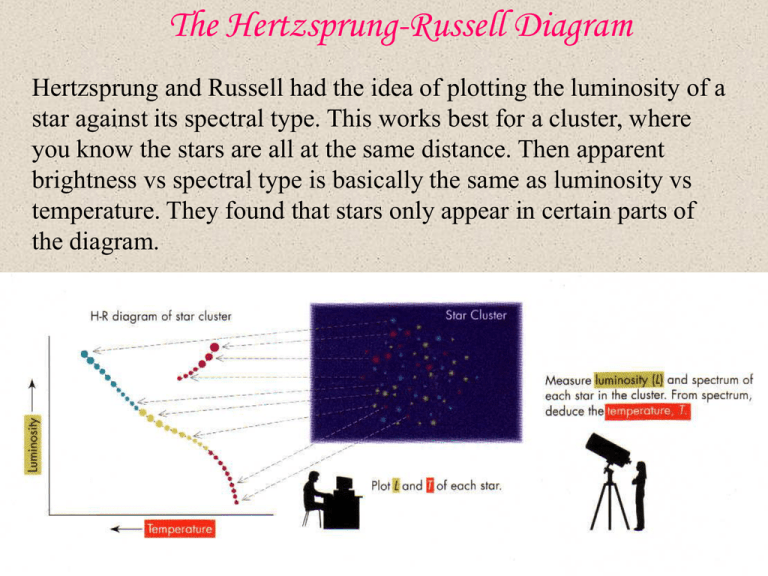
The Hertzsprung-Russell Diagram Hertzsprung and Russell had the idea of plotting the luminosity of a star against its spectral type. This works best for a cluster, where you know the stars are all at the same distance. Then apparent brightness vs spectral type is basically the same as luminosity vs temperature. They found that stars only appear in certain parts of the diagram. Basics of the HR diagram Size Mass Red dwarfs About half the stars in the sky have stellar companions, bound together by gravity and in orbit around each other. Some of these can be seen by the eye or in a telescope, others are too close to be resolved. You can see stars together, but they must also share a common motion and be at the same distance away (but not too far away). If the orbital period is reasonable, orbital motion can be measured. This allow us to determine its tilt. Visual Binary Stars Orbits and Masses of Binaries The primary importance of binaries is that they allow us to measure stellar parameters (especially mass). We get the sum of the masses unless we see both stars moving. Sirius – the brightest star in the sky. Visual Binary Star Images Mizar – in the handle of the Big Dipper. Albireo – The “Cal” star Spectroscopic Binaries If the stars are too close together to be resolved, you may still be able to detect the binary through the Doppler shift (in one or both stars). They must be relatively close to each other (short orbital period). The spectrum of the system might also look like a combination spectrum Spectroscopic Binaries : the tilt problem One problem with spectroscopic binaries is that you can’t tell how badly the Doppler effect has been reduced by the orbital tilt. Fully face on orbits show no line-of-sight velocity at all. You get a lower limit to the sum of the masses (individual masses if both stars have visible spectral lines). Mizar A : resolved by interferometry Orbit face on : small effect Orbit edge on : big effect Eclipsing Binaries Sometimes the orbital plane is lined up so that the stars pass in front of each other as seen from the Earth. Each eclipse will cause the total light from the system to decrease. The amount of the decrease will depend on how much of each star is covered up (they can have different sizes) and on the surface brightness of each star (they can have different temperatures). Eclipsing Binaries – full information You know the system is nearly edge on. Since you also know the velocity (from Doppler shift) and orbital period, you can get the true scale of the system (including star sizes and masses). The separation has to be pretty small for the odds to be good this will happen. Algol – the “demon” star The shape and timing of the eclipses gives the shape and size of the stars. Stellar Parameters from Binaries The masses can be found from M1+M2 (suns) = a(AU)3 / P(yr)2 (individual masses can be gotten if you have a signal from both stars) The orbital period comes from watching the stars, or the periodic variation of their velocity or brightness. To get orbital semimajor axis, you need either the parallax to a visual system or the velocity from a spectroscopic system. In a spectroscopic system, you only have a lower limit unless you know the system tilt. In an eclipsing system, you know everything, including the sizes of the stars. Visual systems should be relatively near the Earth, and have relatively wide separations. Spectroscopic systems need not be near to the Earth, but should have relatively small separations. Eclipsing systems are likely to have even smaller separations (and you have to be lucky). Interferometry is converting some spectroscopic systems into “visual” systems (and resolving the tilt problem). The Mass-Luminosity Diagram Main sequence stars The payoff: we can decode the HR diagram and learn that the main sequence is a mass sequence (and that off the main sequence things are more complicated). HR Diagram - Properties Stars in different parts of the HR Diagram are in different phases of their life cycles. The Main Sequence is set by hydrogen fusion. Masses on the Main Sequence Stellar Sizes Size/Luminosity Hot stars are very bright but very rare. They can affect the light, but not the mass of the Galaxy. Red giants are more common. Most common are red dwarfs. O5 B0 A0 The Structure of a Star A star will take a size and luminosity which balance the crush of gravity against the pressure which fights it and holds up the star. The pressure in a normal star is just thermal pressure from heat. The heat must constantly be replaced, as the star radiates energy into space. How do Stars Shine? The energy output of the Sun is 4x1033 erg/s = 4x10²⁰ megawatts If the Sun were burning coal or gasoline, it could last a few thousand years (which used to be OK) Gravitational contraction is an energy source (gravitational potential energy can be quite potent): could last 10 million years (this IS the source for young stars, brown dwarfs, or black holes) The required shrinkage would be barely noticeable… Converting mass to energy Professor Einstein found the secret to a star’s energy: the equivalence of mass and energy E=mc2 This equation means that if you can manage it, you can convert a little bit of mass into a lot of energy: Units: ergs=gm(cm/s) 2 ; c2~1020 (assuming perfect efficiency) Actually, the hydrogen fusion the Sun uses is only 0.7% efficient, so the fuel requirement to power the Sun is 6x 10¹⁴ gm/s or 700 million tons per sec! Since the Sun’s mass is 2x 1033 gm, it can last for 1012 years at that rate… Elements and Isotopes We define an “element” by the number of protons in its nucleus. There can be “isotopes” with different numbers of neutrons. The number of protons and neutrons must be similar. Thermonuclear Fusion In order to get fusion, you must overcome the electric repulsion. But actually, you must also have both a proton and a neutron. They “stick” by the “strong nuclear force” which only works on unlike particles. The Proton-Proton Cycle


