Click to view poster - The University of Oklahoma
advertisement

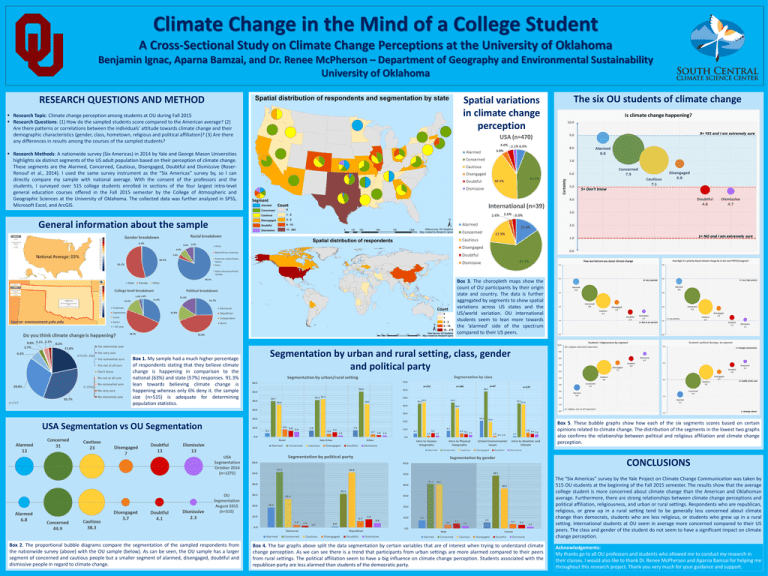
Climate Change in the Mind of a College Student A Cross-Sectional Study on Climate Change Perceptions at the University of Oklahoma Benjamin Ignac, Aparna Bamzai, and Dr. Renee McPherson – Department of Geography and Environmental Sustainability University of Oklahoma RESEARCH QUESTIONS AND METHOD 3.Spatial variations in climate change perception Research Topic: Climate change perception among students at OU during Fall 2015 Research Questions: (1) How do the sampled students score compared to the American average? (2) Are there patterns or correlations between the individuals’ attitude towards climate change and their demographic characteristics (gender, class, hometown, religious and political affiliation)? (3) Are there any differences in results among the courses of the sampled students? Research Methods: A nationwide survey (Six Americas) in 2014 by Yale and George Mason Universities highlights six distinct segments of the US adult population based on their perception of climate change. These segments are the Alarmed, Concerned, Cautious, Disengaged, Doubtful and Dismissive (RoserRenouf et al., 2014). I used the same survey instrument as the “Six Americas” survey by, so I can directly compare my sample with national average. With the consent of the professors and the students, I surveyed over 515 college students enrolled in sections of the four largest intro-level general education courses offered in the Fall 2015 semester by the College of Atmospheric and Geographic Sciences at the University of Oklahoma. The collected data was further analyzed in SPSS, Microsoft Excel, and ArcGIS. The six OU students of climate change Segment Count General information about the sample Count Source: environment.yale.edu Box 1. My sample had a much higher percentage of respondents stating that they believe climate change is happening in comparison to the national (63%) and state (57%) responses. 91.3% lean towards believing climate change is happening whereas only 6% deny it. the sample size (n=515) is adequate for determining population statistics. Box 3. The choropleth maps show the count of OU participants by their origin state and country. The data is further aggregated by segments to show spatial variations across US states and the US/world variation. OU international students seem to lean more towards the ‘alarmed’ side of the spectrum compared to their US peers. Segmentation by urban and rural setting, class, gender and political party Box 5. These bubble graphs show how each of the six segments scores based on certain opinions related to climate change. The distribution of the segments in the lowest two graphs also confirms the relationship between political and religious affiliation and climate change perception. USA Segmentation vs OU Segmentation USA Segmentation October 2014 (n=1272) CONCLUSIONS The “Six Americas” survey by the Yale Project on Climate Change Communication was taken by 515 OU students at the beginning of the Fall 2015 semester. The results show that the average college student is more concerned about climate change than the American and Oklahoman average. Furthermore, there are strong relationships between climate change perceptions and political affiliation, religiousness, and urban or rural settings. Respondents who are republican, religious, or grew up in a rural setting tend to be generally less concerned about climate change than democrats, students who are less religious, or students who grew up in a rural setting. International students at OU seem in average more concerned compared to their US peers. The class and gender of the student do not seem to have a significant impact on climate change perception. OU Segmentation August 2015 (n=515) Box 2. The proportional bubble diagrams compare the segmentation of the sampled respondents from the nationwide survey (above) with the OU sample (below). As can be seen, the OU sample has a larger segment of concerned and cautious people but a smaller segment of alarmed, disengaged, doubtful and dismissive people in regard to climate change. Box 4. The bar graphs above split the data segmentation by certain variables that are of interest when trying to understand climate change perception. As we can see there is a trend that participants from urban settings are more alarmed compared to their peers from rural settings. The political affiliation seem to have a big influence on climate change perception. Students associated with the republican party are less alarmed than students of the democratic party. Acknowledgements: My thanks go to all OU professors and students who allowed me to conduct my research in their classes. I would also like to thank Dr. Renee McPherson and Aparna Bamzai for helping me throughout this research project. Thank you very much for your guidance and support.


