Econ 1 Study Guide Unit 1
advertisement
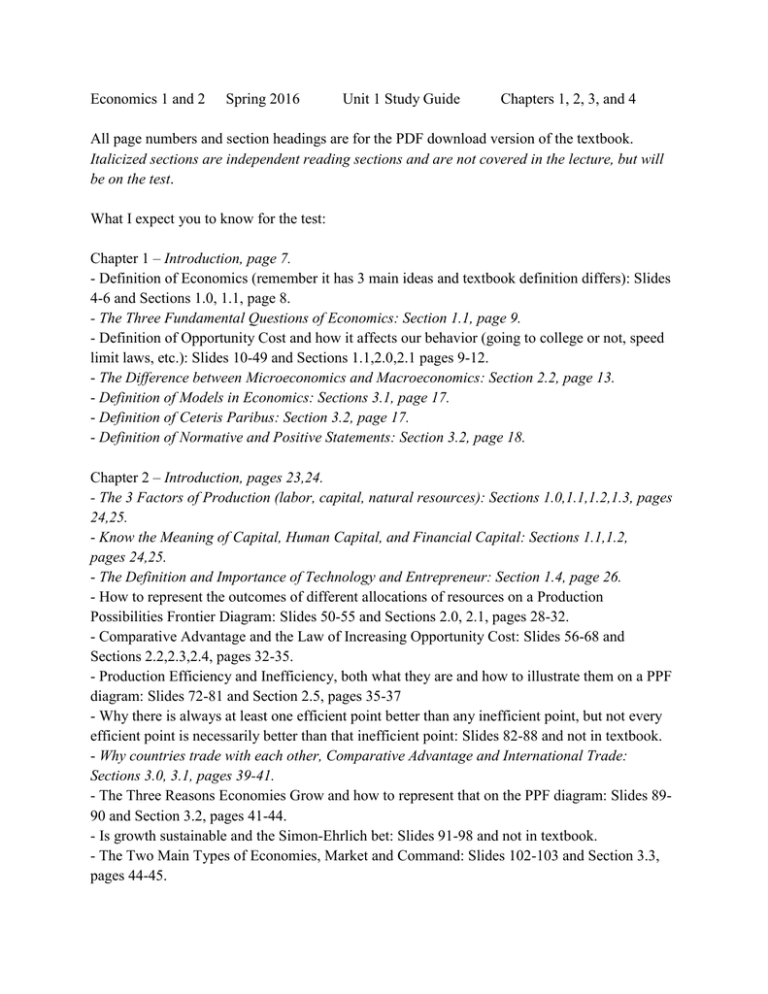
Economics 1 and 2 Spring 2016 Unit 1 Study Guide Chapters 1, 2, 3, and 4 All page numbers and section headings are for the PDF download version of the textbook. Italicized sections are independent reading sections and are not covered in the lecture, but will be on the test. What I expect you to know for the test: Chapter 1 – Introduction, page 7. - Definition of Economics (remember it has 3 main ideas and textbook definition differs): Slides 4-6 and Sections 1.0, 1.1, page 8. - The Three Fundamental Questions of Economics: Section 1.1, page 9. - Definition of Opportunity Cost and how it affects our behavior (going to college or not, speed limit laws, etc.): Slides 10-49 and Sections 1.1,2.0,2.1 pages 9-12. - The Difference between Microeconomics and Macroeconomics: Section 2.2, page 13. - Definition of Models in Economics: Sections 3.1, page 17. - Definition of Ceteris Paribus: Section 3.2, page 17. - Definition of Normative and Positive Statements: Section 3.2, page 18. Chapter 2 – Introduction, pages 23,24. - The 3 Factors of Production (labor, capital, natural resources): Sections 1.0,1.1,1.2,1.3, pages 24,25. - Know the Meaning of Capital, Human Capital, and Financial Capital: Sections 1.1,1.2, pages 24,25. - The Definition and Importance of Technology and Entrepreneur: Section 1.4, page 26. - How to represent the outcomes of different allocations of resources on a Production Possibilities Frontier Diagram: Slides 50-55 and Sections 2.0, 2.1, pages 28-32. - Comparative Advantage and the Law of Increasing Opportunity Cost: Slides 56-68 and Sections 2.2,2.3,2.4, pages 32-35. - Production Efficiency and Inefficiency, both what they are and how to illustrate them on a PPF diagram: Slides 72-81 and Section 2.5, pages 35-37 - Why there is always at least one efficient point better than any inefficient point, but not every efficient point is necessarily better than that inefficient point: Slides 82-88 and not in textbook. - Why countries trade with each other, Comparative Advantage and International Trade: Sections 3.0, 3.1, pages 39-41. - The Three Reasons Economies Grow and how to represent that on the PPF diagram: Slides 8990 and Section 3.2, pages 41-44. - Is growth sustainable and the Simon-Ehrlich bet: Slides 91-98 and not in textbook. - The Two Main Types of Economies, Market and Command: Slides 102-103 and Section 3.3, pages 44-45. - When Market Economies work well and when they don’t: Slides 104-115 and Section 3.4, pages 45-46. Chapter 3 – Introduction, page 55. - Law of Demand and How to Draw a Demand Curve: Slides 117-121 and Sections 1.0, 1.1, pages 56-57. - Five Factors that cause a change in demand along with the difference between a Change in Demand and a Change in Quantity Demanded: Slides 122-137 and Section 1.2, pages 58-62 - Law of Supply and its relation to the Cost of Production (and how the law of increasing opportunity cost fits into this) : Slides 138-143 and Sections 2.0, 2.1, pages 63-64. - How to draw a Supply Curve: Slides 138-143 and Sections 2.0, 2.1, pages 63-64. - Six Factors that cause a change in supply: Slides 144-157 and Section 2.2, pages 64-69. - How to draw a Supply and Demand Diagram to find equilibrium price and quantity: Slides 161163 and Sections 3.0, 3.1, pages 70-72. - How to use a supply and demand curve to find how a change in any of the factors that affect supply or demand will change the equilibrium price and quantity: Slides 164-170 and Section 3.2, pages 73-75. - Understand what happens if both curves shift at the same time: Section 3.2 and pages 75-77. Chapter 4 - Price floors for agricultural products: Slides 172-177 and Sections 2.0, 2.1, pages 94-96. - Price ceilings for New York City apartments: Slides 178-181 and Section 2.2, page 96-97. Sections not covered and not on the test Chapter 1: 2.3 Chapter 2: None Chapter 3: 3.3 Chapter 4: 1.1,1.2,1.3 One of Secretary Chase’s Treasury agents explained how the pressure was felt in New Orleans: A sack of salt could be bought in Federally occupied New Orleans for $1.25. On the far side of Lake Pontchartrain, in Confederate territory, each sack could be sold for anything from $60 to $100. A trader who could take a thousand sacks across the lake, therefore, could make $60,000 or more on an investment of $1,250; and with the money thus made he could buy cotton at ten cents a pound with the certainty that he would get at least sixty cents for at as soon as he got it back within the Federal lines. No government that ever existed could stop a trade which dripped money as copiously as that. Bruce Catton, The Centennial History of the Civil War
