Pre-Algebra Test (10
advertisement
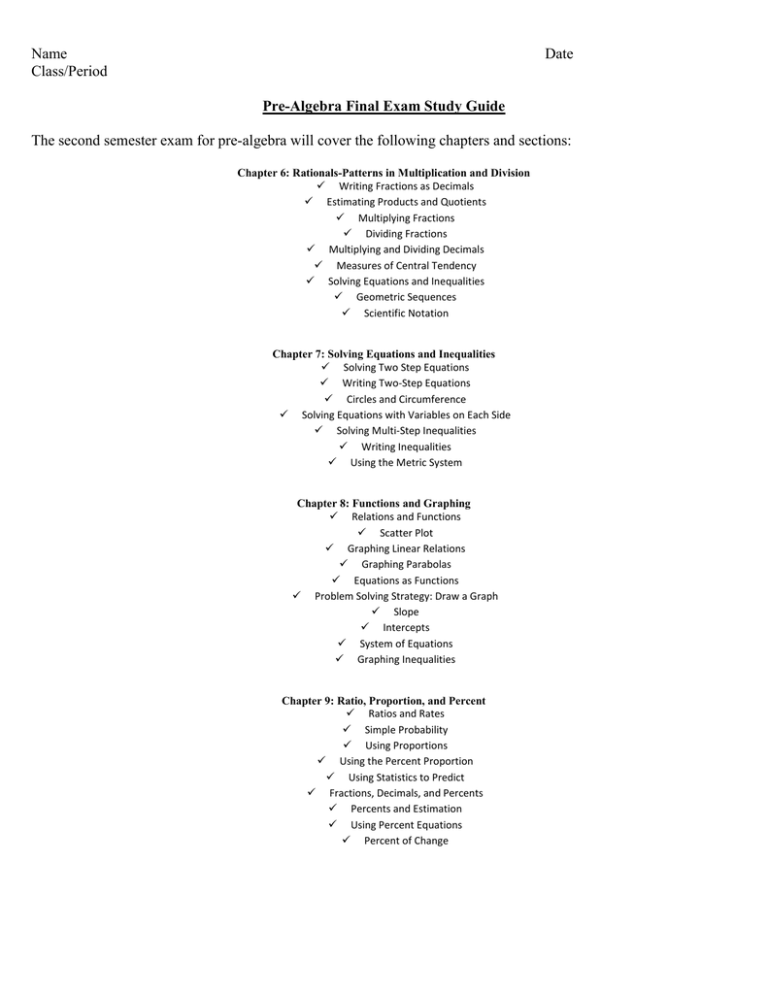
Name Class/Period Date Pre-Algebra Final Exam Study Guide The second semester exam for pre-algebra will cover the following chapters and sections: Chapter 6: Rationals-Patterns in Multiplication and Division Writing Fractions as Decimals Estimating Products and Quotients Multiplying Fractions Dividing Fractions Multiplying and Dividing Decimals Measures of Central Tendency Solving Equations and Inequalities Geometric Sequences Scientific Notation Chapter 7: Solving Equations and Inequalities Solving Two Step Equations Writing Two-Step Equations Circles and Circumference Solving Equations with Variables on Each Side Solving Multi-Step Inequalities Writing Inequalities Using the Metric System Chapter 8: Functions and Graphing Relations and Functions Scatter Plot Graphing Linear Relations Graphing Parabolas Equations as Functions Problem Solving Strategy: Draw a Graph Slope Intercepts System of Equations Graphing Inequalities Chapter 9: Ratio, Proportion, and Percent Ratios and Rates Simple Probability Using Proportions Using the Percent Proportion Using Statistics to Predict Fractions, Decimals, and Percents Percents and Estimation Using Percent Equations Percent of Change Name Class/Period Date Chapter 10: More Statistics and Probability Stem and Leaf Plots Chapter 11: The Language of Geometry Angle Relationships and Parallel Lines Triangles Quadrilaterals Polygons ALL VOCABULARLY THAT WE HAVE COVERED WILL BE INCLUDED Points to remember: 1. The semester exam will require preparation. DO NOT WAIT UNTILTHE LAST MINUTE TO PREPARE FOR YOUR EXAM! 2. To begin your preparation for this exam, students should work through this study guide as well as online IXL problems. Students should then work through their tests and quizzes from his semester that can be found in their math portfolio. Students may check out their portfolios, but it must be returned by your exam day so that your portfolio grade may be recorded. If no portfolio is found for you on exam day, then the portfolio grade is 0. 3. The pre-algebra exam is mostly multiple choice but most problems will require work in order to come up with an answer. All work must be shown on notebook paper. 4. No partial credit is given on exams. Therefore, check and double-check your work. 5. Bring your textbook, notebook paper and a 2 pencils on exam day along with this review sheet to turn in. This review – IF COMPLETED AND WORK SHOWN – will be given bonus points. You must also turn in a textbook in order to receive an exam. If you have checked out your portfolio, you must also turn it in on exam day. NO STUDENT WILL BE ALLOWED TO SIT FOR AN EXAM IF A TEXTBOOK IS NOT TURNED IN. Name Class/Period Date Write each fraction as a decimal. 1. 5 6 2. 8 3. 9 4 15 Estimate the product or quotient 9 4. 10 × 21 5. 18.17 ×6.19 Solve the equations/expressions. 6. 591 m (112) 7. 846 t 538 8. 10 [b (4)] 2 10. p 123 47 12. 4.7 1.2 7m 13. 6c 3 13 14. 3 31 15. 2a – 1 = 3 16. d 2d 1.24 .4 17. 2(f – 3) + 5 = 3 - ( -4) 67w 5561 9. 18. 1 4 2 ×6 21. 4 × 7.07 1 2 11. 171 x 12 1 ÷6 20. −5 3 × 4 22. 1.3 ÷ 100 23. 0.7 ÷ 2.4 19. 4 c 6 Find the mean, median, mode, and range for each set of data. 24. 21, 25, 16, 18, 18, 26, 21, 17, 19, 25 25. 5.4, 4.6, 6.2, 2.7, 8.0 Solve each inequality 26. -25≥ 6.25𝑛 27. 2.6v> 19.76 State whether each sequence is a geometric sequence. If so, state the common ratio and list the next three terms. 28. .5, 2, 3.5, 5, ….. 29. 3, 9, 27, …… Write each number in scientific notation. 30 . 13,490,000 31. .00000674 Name Class/Period Date Write each number in standard form. 32. 4.24 × 10² 33. 3.347 x 10⁻⁶ Define a variable and write an equation for each situation. 34. The sum of six times a number and 4 is 52. 35. Twice a number less 7 is 19. Find the circumference of each circle. 2 36. d=143in 37. r= 4.8m Find the area of each circle. 38. d=3.5 in 39. r=12.45 cm Solve each inequality. Graph the solution on a number line. 40. 5𝑛 + 4 > 34 41. . 52𝑐 + 14.7 ≤ 2.48𝑐 Define a variable and write an inequality for each situation. 42. Eight time a number increased by two is at least 18. 43. Four time a number s exceeds 6 by at least 8. Complete each sentence 44. 6mm=____m 45 40mL=____L Use the coordinate system below to name the ordered pair for each point. 46. A 47 C 48. E 49. G 50. J 51. 52. 53. 54. B D F H Name Class/Period Date Graph and label each point on the coordinate plane below. 55. A (5, 6) 56. C (2, -8) 57. E (-7, 0) 58. B (0, 4) 59. D(-2, 2) 60. F (-5, -3) In which quadrant is each of the ordered pairs located? Use the ordered pairs from previous sections. 61. A 64. B 62. C 65. D 63. E 66. In the graph in #55-60 above, what is the domain? 67. In the graph in #55-60 above, what is the range? 68. Is the graph n #55-60 above a function? Find 4 solutions for each equation and then graph the ordered pairs. 12 x 3 y 9 X -2 69. 70. Y -1 71. 0 72. 1 Find 4 solutions for each equation and then graph the ordered pairs. 1 y x 4 73. 74. 75. 76. X -2 Y -1 0 1 Determine whether each relation is linear. 77. y 4 78. 3 2x y 79. y 1 2 x 4 Name Class/Period Date Solve and graph each inequality (Draw out your own number line) 80. -2x + 9 > 29 81. 7x – 43 > 2(x – 3) Find the slope of each line. 83. 84. Find the slope of the line that contains each pair of points. 85. (6, -3), (8,-2) 86. (0, 1.25), (0.5, 0) 1 ,3 , 2 87. 1 , 2 2 88. (-3, -2), (10, 5) State the x-intercept and y- intercepts of each line. 89. a x int y int 90.b x int y int 91.c x int y int 82. -3x < -21 Name Class/Period Date Find the x-intercept and y-intercept. Use them to graph the equation (2 dots on graph). 92. y = -2x - 3 Find the slope and y-intercept. Then graph the equation using rise/run (2 dots on graph). 93. 4 x 8 y 16 Graph each equation using the slope and y-intercept. 94. y = ¾ X + 1 95. – y = -x -2 Name Class/Period Date 96. 97. Solve the system of equations by graphing. 98 . 99. Write or in each blank to make a true statement. 2.1 6 2.6 1.6 _____ _____ 100. 101. 4.9 1.4 4 0.25 Solve each proportion. 9 3x 85.8 70.2 102. 103. 15 10 d 9 Express each fraction as a percent. 7 97 103. 104. 100 25 Draw an example of each figure. 100. parallelogram 101. triangle 102. trapezoid 105. 7 8 Name Class/Period Date Write each percent as a decimal. ____________103. 27 % ____________104. 3 1/2 % ____________105. 8% ____________106. 15.5 % Write each decimal as a percent. ____________107. .3 ____________108. .08 ____________109. .1475 ____________110. 5.88 Change each percent to a fraction in lowest terms. ____________111. 10 % ____________112. 9% ____________113. 5.4 % Change each fraction to a percent. ____________114. 5 1/8 ____________115. 4/9 ____________116. 7/8 ____________117. 15/3 Compute the following. ____________118. 20 % of 65 ____________119. 1/2 % of 98 ____________120. What percent of 50 is 35? Name Class/Period Date ____________121. 18 is what percent of 12? ____________122. 20 is 12 % of what number? ____________123. Find 150 % of 60 ____________124. 160 % of what number is 36? ____________125. 8 is 20 % of what number? ____________126. 10.4 % of 58 ____________127. Mr. Jarvis pays $32 for his monthly marta pass. Fares are to be increased 6 %. How much will Mr. Jarvis have to pay for his pass after the increase goes into effect? 130. Find the value of y 131. Find the value of x 132. 133. Graph each inequality 134. 𝑦 < 𝑥 − 2 135. 𝑦 ≥ −3𝑥 + 1 Name Class/Period Date Express each ratio as a unit rate. 136. 339.2 miles per 10.6 gallons 137. $425 for 17 tickets There are 6 cans of cola, 4 cans of fruit punch, 9 cans of iced tea, and 2 cans of lemonade in a cooler. Suppose you choose a can randomly. Find each probability. 138. P(cola) 139. P(not carbonated) State whether each percent of change is a percent of increase or a percent of decrease. Then find the percent of increase or decrease. Round to the nearest whole percent. 140. Old: 84 New: 118 151. Original: 15 New: 11.75 Make a stem and leaf plot for the number of points scored at the ELCA basketball games. 152. 64, 60, 72, 61, 73, 80, 68, 70, 65, 67, 70, 80 153. What was the greatest number of points scored? 154. How many games had a score less than 70? 155. What is the range of scores? 156. What is the median score? 157. 158. 159. 160. 161. 162. 163. 164. A __________ angle measures between 0 and 90 degrees. Two angles are __________ if the sum of their measures is 90. When a __________ intersects two parallel lines, the corresponding angles are congruent. When a line is perpendicular to another line, the angles formed are __________ angles. A __________ angle measures between 90 and 180 degrees. A parallelogram with four congruent sides is a __________. Two angles are __________ if the sum of their measures is 180 degrees. 165. Name Class/Period 166. Date 167. A triangle has angle measurements of 52°, 66° 𝑎𝑛𝑑 62°. What kind of triangle is it?


