11-21 Homework
advertisement
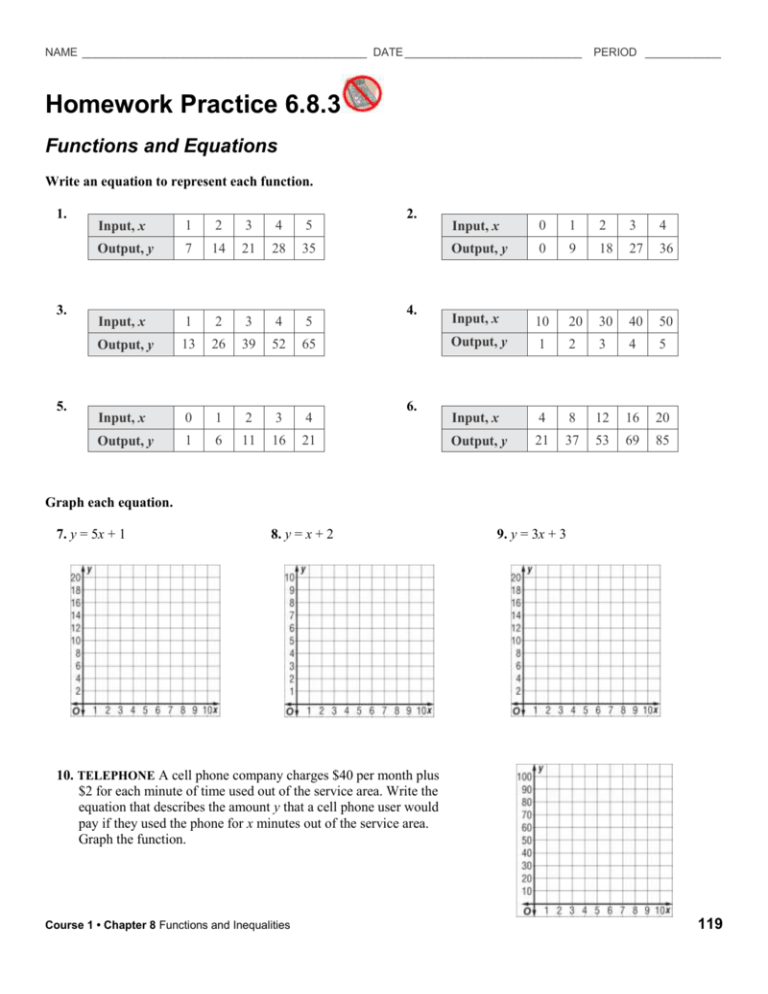
NAME _____________________________________________ DATE ____________________________ PERIOD ____________ Homework Practice 6.8.3 Functions and Equations Write an equation to represent each function. 1. 3. 5. Input, x 1 2 3 4 5 Output, y 7 14 21 28 35 Input, x 1 2 3 4 5 Output, y 13 26 39 52 65 Input, x 0 1 2 3 4 Output, y 1 6 11 16 21 2. 4. 6. Input, x 0 1 2 3 4 Output, y 0 9 18 27 36 Input, x 10 20 30 40 50 Output, y 1 2 3 4 5 Input, x 4 8 12 16 20 Output, y 21 37 53 69 85 Graph each equation. 7. y = 5x + 1 8. y = x + 2 9. y = 3x + 3 10. TELEPHONE A cell phone company charges $40 per month plus $2 for each minute of time used out of the service area. Write the equation that describes the amount y that a cell phone user would pay if they used the phone for x minutes out of the service area. Graph the function. Course 1 • Chapter 8 Functions and Inequalities 119 NAME _____________________________________________ DATE ____________________________ PERIOD ____________ Study Guide 6.8.3 Functions and Equations A function table displays input and output values that represent a function. The function displayed in a function table can be represented with an equation. Example 1 Write an equation to represent the function. Examine how the value of each input and output changes. Input, x 1 2 3 4 5 Output, y 5 10 15 20 25 Input, x 1 2 3 4 5 Output, y 5 10 15 20 25 Each output y is equal to 5 times the input x. So, the equation that represents the function is y = 5x. Example 2 Graph the equation y = 5x. Select any three values for the input x, for example, 0, 1, and 2. Substitute these values for x to find the output y. x 0 1 2 5x 5(0) 5(1) 5(2) y (x, y) 0 (0, 0) 5 (1, 5) 10 (2, 10) The ordered pairs (0, 0), (1, 5), and (2, 10) represent the function. They are solutions of the equation. Course 1 • Chapter 8 Functions and Inequalities 119
