Temperature and Kinetic Energy Web Quest Methods of Thermal
Temperature and Kinetic Energy Web Quest
Methods of Thermal Energy Transfer
Objective: Explore the three methods of heat transfer: conduction, radiation and convection using online simulations and be able to identify examples of each.
1.
Go to http://www.teachersdomain.org/asset/lsps07_int_heattransfer/ .
2.
Read the introduction and then proceed to click on each type of heat transfer. For each type of heat transfer, read the accompanying text and go through the animation to see an example in action. Don’t forget to also click and view the
“Examples” tab. Complete the information in the attached table for each type of heat transfer as you go.
3.
Apply heat transfer methods to cooking by going here http://www.scienceapplets.com/2012/10/summary-of-conduction-convectionand.html
. Scroll down until you see the “Summary of Conduction, Convection and Radiation (with quiz)”. Describe the three examples in the quiz:
Radiation-
Convection-
Conduction-
4.
Test your knowledge by completing the activity here http://www.classzone.com/books/ml_science_share/vis_sim/mem05_pg119_heat/ mem05_pg119_heat.html
Write down your results in the table.
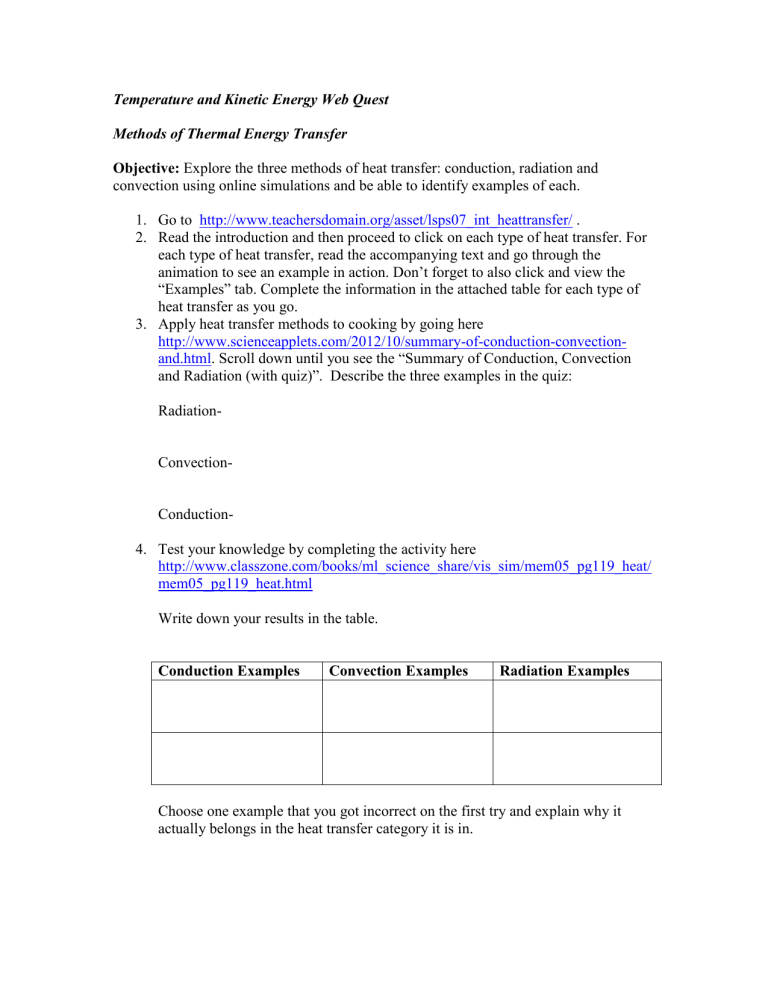
Conduction Examples Convection Examples Radiation Examples
Choose one example that you got incorrect on the first try and explain why it actually belongs in the heat transfer category it is in.
Method of Heat
Transfer
Radiation
Conduction
Convection
Description Describe the animation Other examples
Conductors versus Insulators
Objective: Use simulations to explore examples of conductors and insulators as they relate to thermal energy transfer.
1.
Go to http://www.sciencekids.co.nz/gamesactivities/keepingwarm.html
and scroll down until you see the simulation.
2.
Insulate the beaker by choosing what you think is the best thermal insulator until you are correct.
3.
Now you will complete an online experiment in which you determine how conductive (or how insulating) different materials are. a.
First, you are going to see how the liquid temperature changes with time when the beaker is not wrapped with material. b.
Click the start button. At 10 minutes hit pause. It’s okay if you can’t hit pause exactly at 10 minutes. Close to 10 minutes should be okay. c.
Remember the temperature of the liquid and then click on the “Table” button at the bottom to record this temperature in the table. d.
Go back to the simulation by clicking on the “Activity” button. e.
Click the start button again. Hit pause at 20 minutes and record the temperature again. f.
Repeat this until you have a temperature reading for 0,10,20,30,40,50,an
60 minutes in your table g.
Click on the “Reset” button below and repeat the entire experiment but this time cover the beaker with “Polystrene”. Next you will repeat the experiment with “Cardboard” and then “Metal Foil” so that your data table is complete. Note, you will have to click “Reset” before experimenting with each new material.
4.
Click the button “Check” on the bottom to see if your data is correct. If you have any incorrect data, the box will be red and you should redo that part of the experiment to get the correct data.
5.
Once your data is correct and completed, print it out or copy it on another sheet of paper.
6.
Using your data, rank the three materials tested from most conductive (closer to the conductor end) to least conductive (closer to the insulators end).
7.
Now, let’s check out some other materials. Go here http://www.scienceapplets.com/2012/06/conductors-and-insulators-game.html
.
Scroll down until you see the “Conductors and Insulators” Game. When you finish, the game, copy down the correct answers.
Hurricanes as Heat Engines
Teacher notes: This activity is a pre-written activity by NASA where students see a real life application of heat engines as well as develop reading, data analysis and research skills. All instructions and links can be found here: http://mynasadata.larc.nasa.gov/lesson-plans/lesson-plans-middle-schooleducators/?page_id=615?&passid=50
A brief summary of what students will do:
1.
Examine path of Hurricane Rita (Sept 18-24, 2005, Category 5 hurricane)
2.
Create a time series plot of the sea surface temperature (SST) for the Gulf of
Mexico DURING and AFTER the passage of Hurricane Rita using the SST maps provided.
3.
Answer the analysis questions.
SST maps for DURING Rita
Possible SST maps for AFTER
SST Time Series
Analysis
1.
Compare the daily SST maps of the Gulf of Mexico for the dates during and after Hurricane Rita. Do you see any evidence of lowered sea surface temperature in the data maps? Do you notice any delay between the hurricane passage and the effect on SST?
2. Examine your line plot of sea surface temperature for the selected location.
Can you see the effect on the temperature in your line plot after the hurricane passed? How long did it take for the SST to return to the previous temperature?
3. What conclusions can you make about how hurricanes extract heat energy from the ocean? What other effects on SST may be occurring?


