AMS 572 Lecture Notes
advertisement
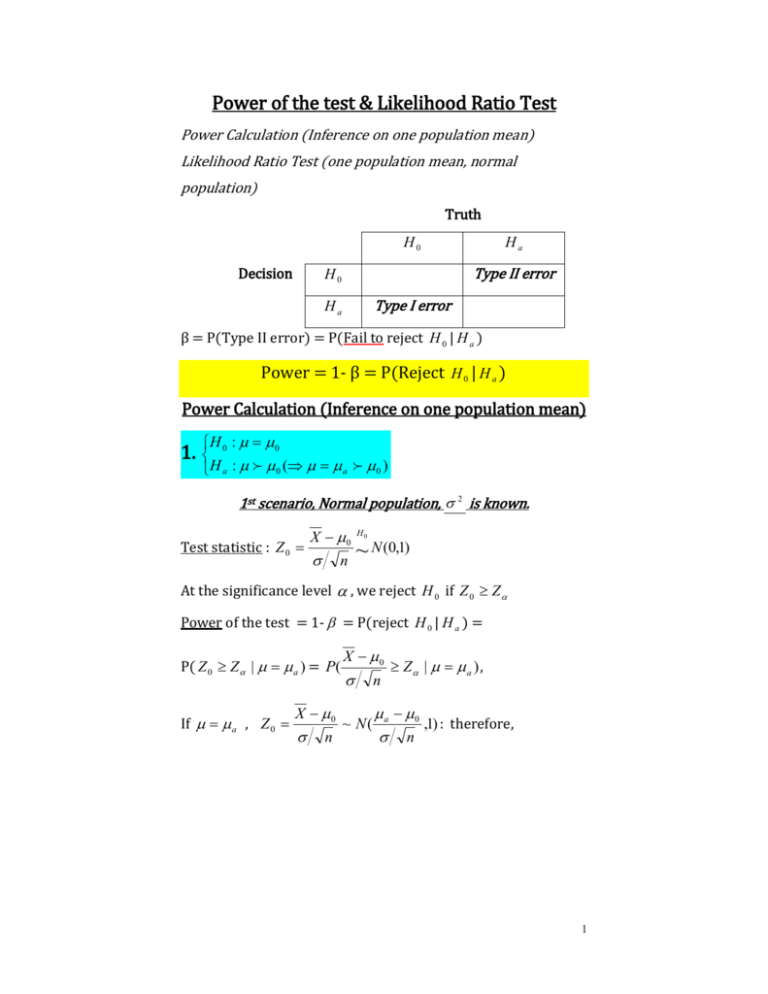
Power of the test & Likelihood Ratio Test Power Calculation (Inference on one population mean) Likelihood Ratio Test (one population mean, normal population) Truth H0 Decision Ha Type II error H0 Type I error Ha β = P(Type II error) = P(Fail to reject H 0 | H a ) Power = 1- β = P(Reject H 0 | H a ) Power Calculation (Inference on one population mean) 1. H 0 : 0 H a : 0 ( a 0 ) 1st scenario, Normal population, 2 is known. Test statistic : Z 0 X 0 n H0 ~ N (0,1) At the significance level , we reject H 0 if Z 0 Z Power of the test = 1- = P(reject H 0 | H a ) = P( Z 0 Z | a ) = P( If a , Z 0 X 0 n X 0 Z | a ) , n ~ N( a 0 ,1) : therefore, n 1 1- = P( X a P( Z Z n a 0 Z | a ) = n a 0 | a ) , n Z ~ N (0,1) Sample size calculation based on given 𝛂 𝐚𝐧𝐝 𝛃: Z Z a 0 n a 0 Z Z n n Z Z 2 2 a 0 2 2nd scenario, Normal population, 2 is unknown. Test statistic : T0 X 0 S n H0 ~t n 1 At the significance level , we reject H 0 if T0 t n 1, Power = 1- = P(reject H 0 | H a ) = P( T0 t n 1, | a ) = P( X 0 S n t n1, | a ) 2 = P( X a S n a 0 S a 0 P(T t n 1, S n n t n1, | a ) = | a ) , Here T ~ t n1 Recall that the Shapiro-Wilk test: can be used to determine whether the population is normal. 3rd scenario, Any population (*usually when the population is found not normal), large sample (n 30 ) Test statistic : Z 0 X 0 S n H0 ~ N (0,1) At the significance level , we reject H 0 if Z 0 Z Power = 1- = P(reject H 0 | H a ) = P( Z 0 Z | a ) = P( X 0 S n Z | a ) = P( X a P( Z Z S n a 0 S n a 0 S n Z | a ) = | a ) , Z ~ N (0,1) 3 2. H 0 : 0 H a : 0 ( a 0 ) 1st scenario, Normal population, 2 is known. Test statistic : Z 0 X 0 n H0 ~ N (0,1) At the significance level , we reject H 0 if Z 0 Z Power = P(reject H 0 | H a ) = P( Z 0 Z | a ) = P( P( X 0 n X a n P( Z Z | a ) = a 0 Z | a ) = n a 0 Z | a ) , n Z ~ N (0,1) Sample size calculation based on given 𝛂 𝐚𝐧𝐝 𝛃: Z Z a 0 n 4 a 0 Z Z n n Z Z 2 2 a 0 2 The derivation of the remaining two scenarios is very similar to that of the first pair of hypotheses too and is thus omitted. 3. H 0 : 0 H a : a 0 1st scenario, Normal population, 2 is known. Test statistic : Z 0 X 0 n H0 ~ N (0,1) At the significance level , we reject H 0 if Z 0 Z 2 Power = P(reject H 0 | H a ) = P( Z 0 Z 2 | a ) = P( Z 0 Z 2 | a ) P( Z 0 Z 2 | a ) = P( X a n a 0 X a a 0 Z 2 | a ) P( Z 2 | a ) n n n = P( Z Z 2 a 0 0 | a ) P( Z Z 2 a | a ) n n (*Without loss of generality, for the plot below, we assume a 0 ) 5 The derivation of the remaining two scenarios is very similar to that of the first pair of hypotheses too and is thus omitted. Ex1) Jerry is planning to purchase a sports goods store. He calculated that in order to make profit, the average daily sales must be $525 . He randomly sampled 36 days and found X $565 and S $50 If the true average daily sales is $550, what is the power of Jerry’s test at the significance level of 0.05? H 0 : 0 525 H a : a 550 0 Sol) Power = P(Reject H 0 | H a ) 6 P( Z 0 Z | a ) P( P( X 0 S n Z | a ) X a S n Z P( Z 1.645 a 0 S n 550 525 50 36 | a ) ) P( Z 1.355) 0.9115 0.9131 0.9123 2 Ex2) John Pauzke, president of Cereal’s Unlimited Inc, wants to be very certain that the mean weight of packages satisfies the package label weight of 16 ounces. The packages are filled by a machine that is set to fill each package to a specified weight. However, the machine has random variability measured by 2 . John would like to have strong evidence that the mean package weight is about 16 oz. George Williams, quality control manager, advises him to examine a random sample of 25 packages of cereal. From his past experience, George knew that the weight of the packages follows a normal distribution with standard deviation 0.4 oz. At the significance level 0.05 , (a) What is the decision rule (rejection region) in terms of the sample mean X ? (b) What is the power of the test when 16.13 oz? Sol) Let X denote the weight of a randomly selected package of cereal, then X ~ N ( 16, 0.4) H 0 : 16 H a : 16 H 0 : 16 H : 16 a (a) Test Statistic : Z 0 X 0 n H0 ~ N (0,1) if 0 16 7 P( Z 0 c | H 0 ) c Z We reject H 0 at 0.05 if Z0 X 0 n Z X 0 Z n 16 1.645 0.4 25 16.1316 (oz ) (b) H 0 : 0 16 H a : a 16.13 0 (n=25) Power = P(Reject H 0 | H a ) P( Z 0 Z | a ) P( P( X 0 n X a n Z | a ) Z P( Z 1.645 a 0 | a ) n 16.13 16 0.4 25 ) P( Z 0.02) 0.49 8 Likelihood Ratio Test (one population mean, normal population) 1. Please derive the likelihood ratio test for H0: μ = μ0 versus Ha: μ ≠ μ0, when the population is normal and population variance σ2 is known. Solution: For a 2-sided test of H0: μ = μ0 versus Ha: μ ≠ μ0, when the population is normal and population variance σ2 is known, we have: , 2 : 0 , 2 2 and , 2 : , 2 2 The likelihoods are: L L 0 , 2 i 1 n x 2 exp i 2 0 2 2 2 1 n 1 2 1 exp 2 2 2 2 x n i 1 i 2 0 There is no free parameter in L , thus Lˆ L . L L , 2 i 1 n x 2 exp i 2 2 2 2 1 n 1 2 1 exp 2 2 2 2 x n i 1 i 2 There is only one free parameter μ in L . Now we shall find the value of μ that maximizes the log likelihood n n 1 xi 2 . ln L ln 2 2 2 i 1 2 2 n d ln L 1 By solving 2 i 1 xi 0 , we have ̂ x d It is easy to verify that ̂ x indeed maximizes the loglikelihood, and thus the likelihood function. Therefore the likelihood ratio is: 9 L 0 , 2 Lˆ ˆ max L , 2 L n L 0 , 2 L ˆ , 2 n 1 2 1 xi 0 2 exp 2 2 i 1 2 2 n n 1 2 1 xi x 2 exp 2 2 i 1 2 2 1 exp 2 2 x n i 1 i 2 2 0 xi x 1 x 2 1 2 0 exp exp z 0 2 2 / n Therefore, the likelihood ratio test that will reject H0 when * is equivalent to the z-test that will reject H0 when Z 0 c , where c can be determined by the significance level α as c z / 2 . 10 2. Please derive the likelihood ratio test for H0: μ = μ0 versus Ha: μ ≠ μ0, when the population is normal and population variance σ2 is unknown. Solution: For a 2-sided test of H0: μ = μ0 versus Ha: μ ≠ μ0, when the population is normal and population variance σ2 is unknown, we have: , 2 : 0 , 0 2 and , : , 0 2 2 The likelihood under the null hypothesis is: L L 0 , 2 i 1 n x 2 exp i 2 0 2 2 2 1 n 1 2 1 2 2 exp 2 2 x n i 1 i 2 0 There is one free parameter, σ2, in L . Now we shall find the value of σ2 that maximizes the log likelihood n 1 n 2 ln L ln 2 2 x 0 . By solving 2 i 1 i 2 2 d ln L n n 1 2 2 4 i1 xi 0 0 , we have 2 d 2 2 1 n 2 ˆ2 i 1 xi 0 n It is easy to verify that this solution indeed maximizes the loglikelihood, and thus the likelihood function. The likelihood under the alternative hypothesis is: L L , 2 i 1 n x 2 exp i 2 2 2 2 1 n 1 2 1 exp 2 2 2 2 x n i 1 i 2 There are two free parameter μ and σ2 in L . Now we shall find the value of μ and σ2 that maximizes the log likelihood n n 1 xi 2 . ln L ln 2 2 2 i 1 2 2 By solving the equation system: ln L 1 n 2 i 1 xi 0 and ln L n n 1 2 2 4 i1 xi 0 2 2 2 11 1 n 2 xi x i 1 n It is easy to verify that this solution indeed maximizes the loglikelihood, and thus the likelihood function. we have ̂ x and ˆ 2 Therefore the likelihood ratio is: n 2 L 0 , ˆ2 L ˆ max 2 L 0 , ˆ max , 2 L , 2 L ˆ , ˆ 2 L n xi 0 2 i n1 xi x 2 i 1 t 1 0 n 1 2 n 2 2 n n exp n 2 2 2 xi 0 i 1 n 2 n n exp n 2 2 xi x 2 i 1 n xi x 2 n x 0 2 i 1 n 2 x x i 1 i n 2 2 n x 0 1 n xi x 2 i 1 n 2 Therefore, the likelihood ratio test that will reject H0 when * is equivalent to the t-test that will reject H0 when t0 c , where c can be determined by the significance level α as c tn 1, / 2 . 3. Optimal property of the Likelihood Ratio Test Theorem (Neyman-Pearson Lemma). The likelihood ratio test for a simple null hypothesis 𝐻0 : 𝜃 = 𝜃 ′ versus a simple alternative hypothesis 𝐻𝑎 : 𝜃 = 𝜃 ′′ is a most powerful test. 12 n 2 Egon Sharpe Pearson (August 11, 1895 – June 12, 1980); Karl Pearson (March 27, 1857 – April 27, 1936); Maria Pearson (née Sharpe); Sigrid Letitia Sharpe Pearson. In 1901, with Weldon and Galton, Karl Pearson founded the journal Biometrika whose object was the development of statistical theory. He edited this journal until his death. In 1911, Karl Pearson founded the world's first university statistics department at University College London. His only son, Egon Pearson, became an eminent statistician himself, establishing the Neyman-Pearson lemma. He succeeded his father as head of the Applied Statistics Department at University College. http://en.wikipedia.org/wiki/Karl_Pearson 13 Jerzy Neyman (April 16, 1894 – August 5, 1981), is best known for the Neyman-Pearson Lemma. He has also developed the concept of confidence interval (1937), and contributed significantly to the sampling theory. He published many books dealing with experiments and statistics, and devised the way which the FDA tests medicines today. Jerzy Neyman was also the founder of the Department of Statistics at the University of California, Berkeley, in 1955. http://en.wikipedia.org/wiki/Jerzy_Neyman Note: Under certain conditions, the likelihood ratio test is also a uniformly most power test for a simple null hypothesis versus a composite alternative hypothesis, or for a composite null hypothesis versus a composite alternative hypothesis. (See for example, the Karlin-Rubin theorem.) 14
