Kinetics of Dye Fading - AP Chemistry with dr hart
advertisement
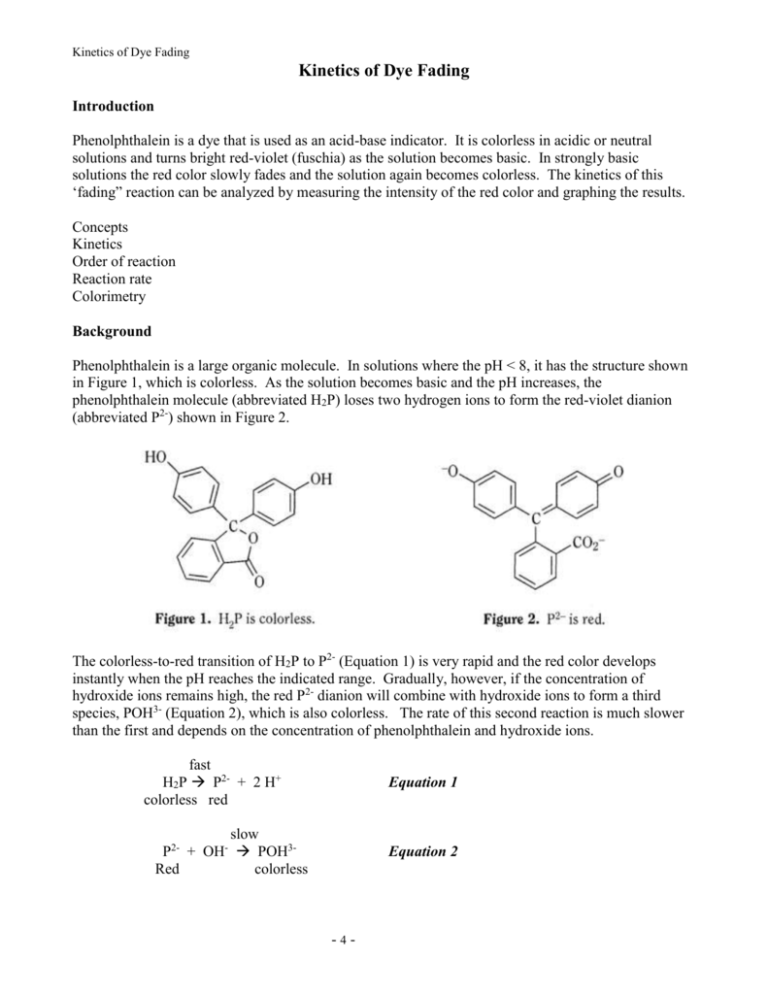
Kinetics of Dye Fading Kinetics of Dye Fading Introduction Phenolphthalein is a dye that is used as an acid-base indicator. It is colorless in acidic or neutral solutions and turns bright red-violet (fuschia) as the solution becomes basic. In strongly basic solutions the red color slowly fades and the solution again becomes colorless. The kinetics of this ‘fading” reaction can be analyzed by measuring the intensity of the red color and graphing the results. Concepts Kinetics Order of reaction Reaction rate Colorimetry Background Phenolphthalein is a large organic molecule. In solutions where the pH < 8, it has the structure shown in Figure 1, which is colorless. As the solution becomes basic and the pH increases, the phenolphthalein molecule (abbreviated H2P) loses two hydrogen ions to form the red-violet dianion (abbreviated P2-) shown in Figure 2. The colorless-to-red transition of H2P to P2- (Equation 1) is very rapid and the red color develops instantly when the pH reaches the indicated range. Gradually, however, if the concentration of hydroxide ions remains high, the red P2- dianion will combine with hydroxide ions to form a third species, POH3- (Equation 2), which is also colorless. The rate of this second reaction is much slower than the first and depends on the concentration of phenolphthalein and hydroxide ions. fast H2P P2- + 2 H+ colorless red Equation 1 slow P2- + OH- POH3Red colorless Equation 2 -4- Kinetics of Dye Fading The kinetics of the “fading” reaction can be followed by measuring the concentration of P2- versus time and graphing the results. Figure 3 illustrates how the concentration of a reactant decreases with time over the course of a reaction. Notice that the graph of concentration versus time is a curved line, not a straight line. The curve levels off as it approaches the x-axis. This means that the reaction slows down as the reactant concentration decreases. Exactly how much the rate decreases as the reactant concentration decreases depends on the rate law for the reaction. In the case of the reaction of P2- with OH- ions, the rate law has the general form Rate = k[P2-]m[OH-]n Equation 3 The exponents m and n are defined as the order of reaction for each reactant and k is the rate constant for the reaction at a particular temperature. The values of the exponents m and n must be determined by experiment. If the reaction is carried out under conditions where the concentration of OH- does not change – by using a large excess of hydroxide ions – then the rate law will reduce to the form Rate = k’[P2-]n Equation 4 Where k’ is a new “pseudo” rate constant incorporating both the “true” rate constant k and the experimentally constant [OH-]m term. Mathematical treatment of the equations for the reaction rate and the rate law predicts the following outcomes: If the fading reaction is first order in [P2-] (that is, n = 1), a graph of the natural log (ln) of [P2-] versus time will give a straight line. The slope of the line is equal to –k’. If the fading reaction is second order in [P2-] (that is, n = 2), a graph of 1/[P2-] versus time will give a straight line. The slope of the line is equal to –k’. Experiment Overview The purpose of this experiment is to use colorimetry and graphical analysis to determine how the rate of the phenolphthalein fading reaction depends on the concentration of the dye. A colorimeter is a special instrument that measures the absorbance of light. A known amount of phenolphthalein will be -5- Kinetics of Dye Fading added to a large excess of sodium hydroxide, and the absorbance (Abs) of the red solution will be measured at specific time intervals. Absorbance is directly proportional to concentration, and so a graph of absorbance versus time has the same characteristics as a graph of concentration versus time (Figure 3). Graphing the absorbance data (ln Abs versus time and 1/Abs versus time) should reveal whether the fading reaction is first or second order in phenolphthalein. Pre-Lab Questions Crystal violet (CV) is another indicator dye that combines with hydroxide ions to form a colorless product (Equation 5). Crystal violet was added to 0.10 M NaOH and the solution immediately turned violet. After 10 minutes, the color faded and the solution was almost colorless. The following absorbance measurements were recorded. CV+ + OH- CVOH violet colorless Reaction Time 1 min. 2 min. 3 min. 4 min. 5 min. 6 min. 7 min. 8 min. 9 min. 10 min. Equation 5 Absorbance 0.366 0.251 0.176 0.124 0.089 0.065 0.048 0.037 0.029 0.023 ln(Abs) 1/Abs 1. Calculate the values of ln(Abs) and 1/Abs for each absorbance measurement to complete the table. 2. Create two graphs – plot ln(Abs) versus time on your first graph and 1/Abs versus time on your second graph. 3. Which graph more closely approximates a straight line? Is the reaction of crystal violet with hydroxide ions (Equation 5) first or second order in crystal violet? -6- Kinetics of Dye Fading Materials Dilute phenolphthalein solution, 1 drop Sodium hydroxide, NaOH, 0.2 M, ~5 mL LabQuest Colorimeter Digital thermometer Tissues Wash bottle and distilled water Cuvette Computer (for data analysis) Safety precautions Sodium hydroxide is a corrosive liquid. Avoid contact with eyes and skin and clean up all spills immediately. Phenolphthalein is moderately toxic by ingestion. Wear chemical splash goggles and apron. Wash hands thoroughly with soap and water before leaving the laboratory. Procedure 1. Obtain and wear goggles. 2. Plug the LabQuest into power. Connect a Colorimeter to Channel 1 of the LabQuest interface. 3. Set up the LabQuest for the Colorimeter. a. Turn on the LabQuest. b. Make sure the live readout on the screen is Absorbance. 4. Set up the data collection mode. Adjust time by clicking on “length” and entering 60 (sec) in the Interval box and 960 (sec) in the length box (total = 16 minutes). 5. Calibrate the Colorimeter. a. Prepare a blank by filling an empty cuvette ¾ full with 0.2 M NaOH. Wipe the clear sides of the cuvette with tissue, then place it in the cuvette slot of the Colorimeter with one of the clear sides next to the arrow inside the compartment. Close the lid. b. Set the wavelength on the Colorimeter to 565 nm using the arrows on the Colorimeter pad, then press the CAL button. Calibration takes a few seconds. You will see the red light on the colorimeter blink, then go dark. 6. Remove the cuvette from the Colorimeter compartment. Measure and (manually) record the initial temperature of the sodium hydroxide solution in the cuvette using a digital thermometer. 7. Add one drop of dilute phenolphthalein to the cuvette and immediately press the Collect button on the LabQuest (directly below the screen, or touch on the bottom left of the screen. This ensures that the absorbance versus time measurement will accurately reflect the time of reaction from the time of mixing. -7- Kinetics of Dye Fading 8. Place the lid on the cuvette and carefully invert the cuvette several times to mix the solution. 9. Place the cuvette in the Colorimeter compartment and close the lid. Measurements will continue for a total of 16 minutes. 10. Remove the cuvette. Measure the temperature of the solution in the cuvette, using the same digital thermometer. Record the temperature. 11. Put your thumb drive into the USB port, then press FILE, then SAVE. Click on the box at the top of the screen and type in your chosen name for the file. A keyboard will automatically appear, allowing you to type in the name of the file. Be sure to click on the USB icon to save the file. If the USB icon does not appear, wait a minute or so, then try again. 12. At home, upload your data to your computer in Logger Pro. Label the graph with your name. Data Analysis and Discussion 1. Delete the first data point by highlighting the first row, then holding down the alt button while clicking on “-“, so that it does not interfere with your calculations. You may instead use the Edit drop-down menu and “strike through data cells” to do the same thing. 2. Examine your graph of absorbance versus time. Does the “rate of fading” of phenolphthalein depend on the concentration of the dye? Explain. 3. Calculate the values of ln(Abs) and 1/Abs for each absorbance measurement: create a new “calculated column” under the “Data” drop-down menu. From the “Insert” menu, choose “new graph”. Dr. Hart found creating the new graph for ln(Abs) before creating a second calculated column for 1/Abs worked best. 4. Which graph more closely approximates a straight line? Use the “linear fit” function (top menu) to determine and demonstrate the linearity of the graphs. 5. Is the reaction of phenolphthalein with hydroxide ions (Equation 2) first or second order in phenolphthalein? 6. What effect, if any, would an increase in temperature have on the results of the experiment? 7. The concentration of sodium hydroxide is assumed to be constant throughout the reaction and is thus included in the “reduced” rate law expression (See Equation 4 in the Background section). Is this assumption valid? Prove it. 8. Be sure to include a printout of your graphs when you turn in your lab report. -8-

