Hierarchical Nanomanufacturing of Carbon Nanotube Sheets and
advertisement
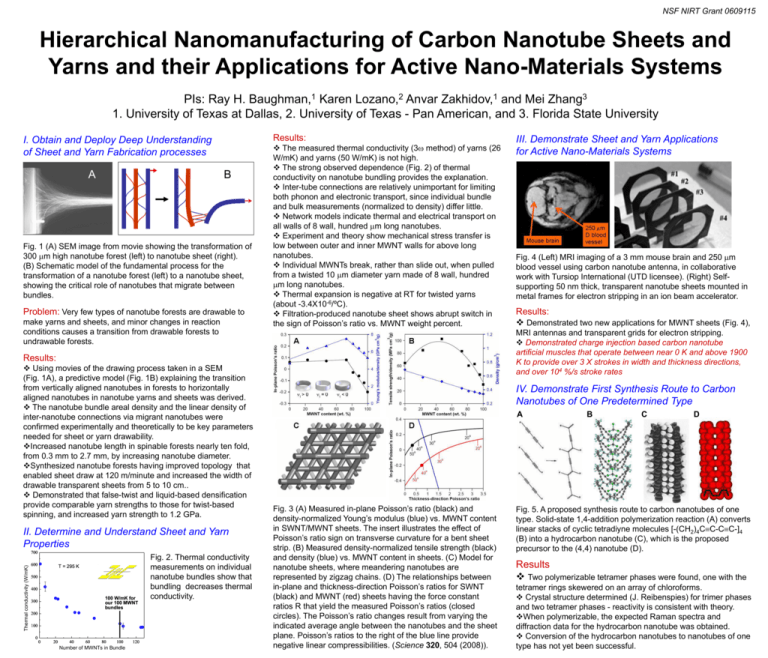
NSF NIRT Grant 0609115 Hierarchical Nanomanufacturing of Carbon Nanotube Sheets and Yarns and their Applications for Active Nano-Materials Systems 1 Baughman, 2 Lozano, 1 Zakhidov, 3 Zhang PIs: Ray H. Karen Anvar and Mei 1. University of Texas at Dallas, 2. University of Texas - Pan American, and 3. Florida State University Results: I. Obtain and Deploy Deep Understanding of Sheet and Yarn Fabrication processes A A B B Fig. 1 (A) SEM image from movie showing the transformation of 300 m high nanotube forest (left) to nanotube sheet (right). (B) Schematic model of the fundamental process for the transformation of a nanotube forest (left) to a nanotube sheet, showing the critical role of nanotubes that migrate between bundles. Problem: Very few types of nanotube forests are drawable to make yarns and sheets, and minor changes in reaction conditions causes a transition from drawable forests to undrawable forests. The measured thermal conductivity (3 method) of yarns (26 W/mK) and yarns (50 W/mK) is not high. The strong observed dependence (Fig. 2) of thermal conductivity on nanotube bundling provides the explanation. Inter-tube connections are relatively unimportant for limiting both phonon and electronic transport, since individual bundle and bulk measurements (normalized to density) differ little. Network models indicate thermal and electrical transport on all walls of 8 wall, hundred m long nanotubes. Experiment and theory show mechanical stress transfer is low between outer and inner MWNT walls for above long nanotubes. Individual MWNTs break, rather than slide out, when pulled from a twisted 10 m diameter yarn made of 8 wall, hundred m long nanotubes. Thermal expansion is negative at RT for twisted yarns (about -3.4X10⁻⁶/ºC). Filtration-produced nanotube sheet shows abrupt switch in the sign of Poisson’s ratio vs. MWNT weight percent. II. Determine and Understand Sheet and Yarn Properties L=10 m, d=10 nm, R=560 k, _=56 k/m Thermal conductivity conductivity, (W/mK) W/mK Thermal 700 T=295K 600 T = 295 K 500 400 100 W/mK for our 100 MWNT bundles 300 200 100 0 0 20 40 60 80 100 Number Bundle Number of of MWNTs MWNT ininbundle 120 Fig. 2. Thermal conductivity measurements on individual nanotube bundles show that bundling decreases thermal conductivity. Fig. 4 (Left) MRI imaging of a 3 mm mouse brain and 250 m blood vessel using carbon nanotube antenna, in collaborative work with Tursiop International (UTD licensee). (Right) Selfsupporting 50 nm thick, transparent nanotube sheets mounted in metal frames for electron stripping in an ion beam accelerator. Results: Demonstrated two new applications for MWNT sheets (Fig. 4), MRI antennas and transparent grids for electron stripping. Demonstrated charge injection based carbon nanotube artificial muscles that operate between near 0 K and above 1900 K to provide over 3 X strokes in width and thickness directions, and over 104 %/s stroke rates Results: Using movies of the drawing process taken in a SEM (Fig. 1A), a predictive model (Fig. 1B) explaining the transition from vertically aligned nanotubes in forests to horizontally aligned nanotubes in nanotube yarns and sheets was derived. The nanotube bundle areal density and the linear density of inter-nanotube connections via migrant nanotubes were confirmed experimentally and theoretically to be key parameters needed for sheet or yarn drawability. Increased nanotube length in spinable forests nearly ten fold, from 0.3 mm to 2.7 mm, by increasing nanotube diameter. Synthesized nanotube forests having improved topology that enabled sheet draw at 120 m/minute and increased the width of drawable transparent sheets from 5 to 10 cm.. Demonstrated that false-twist and liquid-based densification provide comparable yarn strengths to those for twist-based spinning, and increased yarn strength to 1.2 GPa. III. Demonstrate Sheet and Yarn Applications for Active Nano-Materials Systems IV. Demonstrate First Synthesis Route to Carbon Nanotubes of One Predetermined Type A Fig. 3 (A) Measured in-plane Poisson’s ratio (black) and density-normalized Young’s modulus (blue) vs. MWNT content in SWNT/MWNT sheets. The insert illustrates the effect of Poisson’s ratio sign on transverse curvature for a bent sheet strip. (B) Measured density-normalized tensile strength (black) and density (blue) vs. MWNT content in sheets. (C) Model for nanotube sheets, where meandering nanotubes are represented by zigzag chains. (D) The relationships between in-plane and thickness-direction Poisson’s ratios for SWNT (black) and MWNT (red) sheets having the force constant ratios R that yield the measured Poisson’s ratios (closed circles). The Poisson’s ratio changes result from varying the indicated average angle between the nanotubes and the sheet plane. Poisson’s ratios to the right of the blue line provide negative linear compressibilities. (Science 320, 504 (2008)). B C D Fig. 5. A proposed synthesis route to carbon nanotubes of one type. Solid-state 1,4-addition polymerization reaction (A) converts linear stacks of cyclic tetradiyne molecules [-(CH2)4CC-CC-]4 (B) into a hydrocarbon nanotube (C), which is the proposed precursor to the (4,4) nanotube (D). Results Two polymerizable tetramer phases were found, one with the tetramer rings skewered on an array of chloroforms. Crystal structure determined (J. Reibenspies) for trimer phases and two tetramer phases - reactivity is consistent with theory. When polymerizable, the expected Raman spectra and diffraction data for the hydrocarbon nanotube was obtained. Conversion of the hydrocarbon nanotubes to nanotubes of one type has not yet been successful.

![Description This tool runs the model described in Ref. [1] below. It](http://s3.studylib.net/store/data/007555824_1-2f0124cd3aa95426766ad7b8bcd713b0-300x300.png)
