Exercises 14-3, 14-4, and 14-13, located in WileyPLUS
o Problem 14-6A, located in WileyPLUS
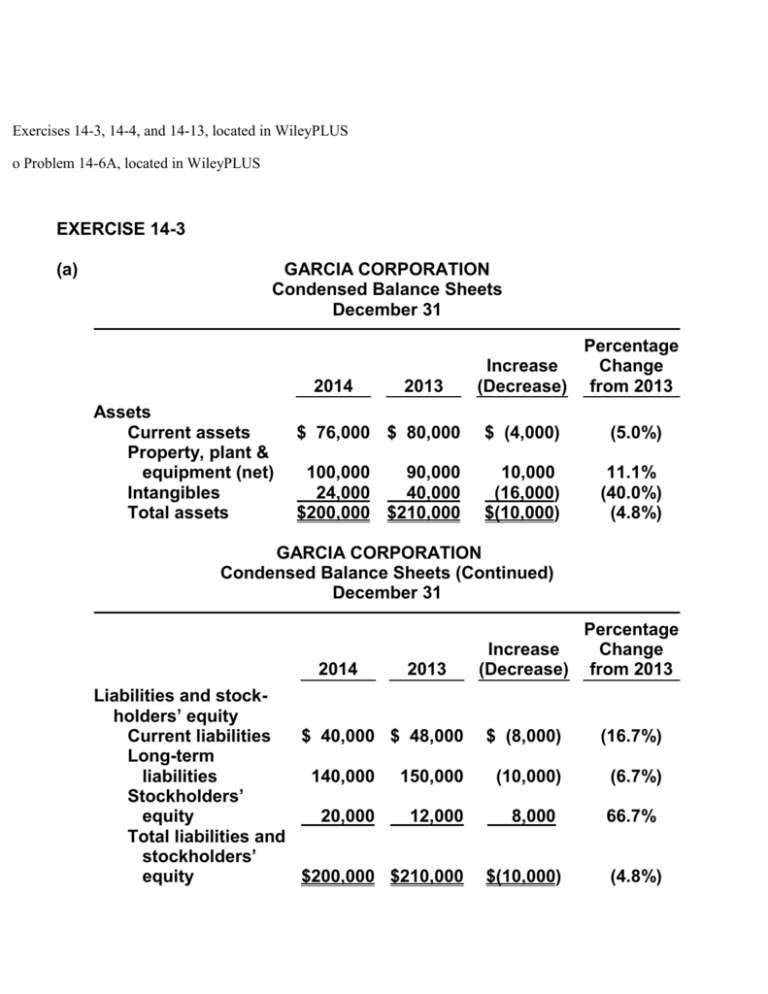
EXERCISE 14-3
(a)
GARCIA CORPORATION
Condensed Balance Sheets
December 31
2014
Assets
Current assets
Property, plant &
equipment (net)
Intangibles
Total assets
2013
Percentage
Increase
Change
(Decrease) from 2013
$ 76,000 $ 80,000
$ (4,000)
(5.0%)
100,000
90,000
24,000
40,000
$200,000 $210,000
(10,000)
(16,000)
$(10,000)
(11.1%)
(40.0%)
(4.8%)
GARCIA CORPORATION
Condensed Balance Sheets (Continued)
December 31
2014
2013
Liabilities and stockholders’ equity
Current liabilities
$ 40,000 $ 48,000
Long-term
liabilities
140,000 150,000
Stockholders’
equity
20,000
12,000
Total liabilities and
stockholders’
equity
$200,000 $210,000
Percentage
Increase
Change
(Decrease) from 2013
$ (8,000)
(16.7%)
(10,000)
(6.7%)
8,000)
(66.7%)
$(10,000)
(4.8%)
(b)
GARCIA CORPORATION
Condensed Balance Sheet
December 31, 2014
Amount
Percent
Assets
Current assets
Property, plant, and equipment (net)
Intangibles
Total assets
$ 76,000
100,000
24,000
$200,000
38%
50%
12%
100%
Liabilities and stockholders’ equity
Current liabilities
Long-term liabilities
Stockholders’ equity
Total liabilities and stockholders’ equity
$ 40,000
140,000
20,000
$200,000
20%
70%
10%
100%
quest2096801ent
quest2096801
asnmt967525
take-question
a
Exercise 14-3
Your answer is correct.
The comparative condensed balance sheets of Garcia Corporation are presented below.
GARCIA CORPORATION
Comparative Condensed Balance Sheets
December 31
2014
2013
$ 76,000
$ 80,000
100,000
90,000
24,000
40,000
$200,000
$210,000
Assets
Current assets
Property, plant, and equipment (net)
Intangibles
Total assets
Liabilities and stockholders’ equity
Current liabilities
$ 40,000
$ 48,000
Long-term liabilities
140,000
150,000
Stockholders’ equity
20,000
12,000
Total liabilities and stockholders’ equity
$200,000
$210,000
(a) Prepare a horizontal analysis of the balance sheet data for Garcia Corporation using 2013 as a base. (If amount
and percentage are a decrease show the numbers as negative, e.g. -55,000, -20% or (55,000). (20%).
Round percentages to 1 decimal place, e.g. 12.3%.)
GARCIA CORPORATION
Condensed Balance Sheets
December 31
2014
2013
Percentage
Change from
2013
Increase
(Decrease)
Assets
$
Current Assets
$76,000
$80,000
(4000)
Property, Plant & Equipment (net)
100,000
90,000
10000
24,000
40,000
(16000)
Intangibles
Total assets
(5.0)
%
11.1
%
(40.0)
%
$
$200,000
$210,000
Current Liabilities
$40,000
$48,000
(8000)
Long-term Liabilities
140,000
150,000
(10000)
Stockholders' Equity
20,000
12,000
$200,000
$210,000
(4.8)
(10000)
%
Liabilities and Stockholders' Equity
Total liabilities and stockholders' equity
$
(16.7)
%
%
66.7
8000
%
$
(10000)
(4.8)
%
(b) Prepare a vertical analysis of the balance sheet data for Garcia Corporation in columnar form for 2014. (Round
percentages to 0 decimal places, e.g. 12%.)
GARCIA CORPORATION
Condensed Balance Sheet
December 31, 2014
Amount
Percent
Assets
Current Assets
$76,000
38
Property, Plant, and Equipment (net)
100,000
50
24,000
12
Intangibles
%
%
%
Total assets
$200,000
100
%
Liabilities and Stockholders' Equity
Current Liabilities
$40,000
20
Long-term Liabilities
140,000
70
Stockholders' Equity
20,000
10
Total liabilities and stockholders' equity
$200,000
%
%
%
100
%
Click here if you would like to Show Work for this question
Question Attempts: 2 of 3 used
EXERCISE 14-4
(a)
HENDI CORPORATION
Condensed Income Statements
For the Years Ended December 31
Net sales
Cost of goods sold
Gross profit
Operating expenses
Net income
2014
2013
$600,000
468,000
132,000
60,000
$ 72,000
$500,000
400,000
100,000
54,000
$ 46,000
Increase or (Decrease)
During 2013
Amount
Percentage
$100,000
68,000
32,000
6,000
$ 26,000
20.0%
17.0%
32.0%
11.1%
56.5%
(b)
HENDI CORPORATION
Condensed Income Statements
For the Years Ended December 31
2014
Net sales
Cost of goods sold
Gross profit
Operating expenses
Net income
quest2096802ent
quest2096802
Amount
Percent
2013
Amount
Percent
$600,000
468,000
132,000
60,000
$ 72,000
100.0%
78.0%
22.0%
10.0%
12.0%
$500,000
400,000
100,000
54,000
$ 46,000
asnmt967525
100.0%
80.0%
20.0%
10.8%
9.2%
take-question
a
Exercise 14-4
Your answer is correct.
The comparative condensed income statements of Hendi Corporation are shown below.
HENDI CORPORATION
Comparative Condensed Income Statements
For the Years Ended December 31
2014
Net sales
2013
$600,000
$500,000
Cost of goods sold
468,000
400,000
Gross profit
132,000
100,000
60,000
54,000
$ 72,000
$ 46,000
Operating expenses
Net income
(a) Prepare a horizontal analysis of the income statement data for Hendi Corporation using 2013 as a
base. (Show the amounts of increase or decrease.) (If amount and percentage are a decrease
show the numbers as negative, e.g. -55,000, -20% or (55,000). (20%). Round percentages
to 1 decimal place, e.g. 12.3%.)
HENDI CORPORATION
Condensed Income Statements
For the Years Ended December 31
Increase or (Decrease)
During 2013
Net sales
Cost of goods sold
2014
2013
$600,000
$500,000
468,000
400,000
Amount
$
Percentage
100000
20.0
68000
17.0
%
%
Gross profit
Operating expenses
Net income
132,000
100,000
60,000
54,000
$72,000
$46,000
$
32000
32.0
6000
11.1
26000
56.5
%
%
%
(b) Prepare a vertical analysis of the income statement data for Hendi Corporation in columnar form
for both years. (Round percentages to 1 decimal place, e.g. 12.3%.)
HENDI CORPORATION
Condensed Income Statements
For the Years Ended December 31
2014
Amount
Net sales
Percent
$600,000
100.0
Cost of goods sold
468,000
78.0
Gross profit
132,000
22.0
60,000
10.0
$ 72,000
12.0
Operating expenses
Net income
2013
Amount
%
%
%
%
%
Percent
$500,000
100.0
400,000
80.0
100,000
20.0
54,000
10.8
$ 46,000
9.2
%
%
%
%
%
Click here if you would like to Show Work for this question
Question Attempts: 1 of 3 used
EXERCISE 14-13
(a)
MAULDER CORPORATION
Partial Income Statement
For the Year Ended December 31, 2014
Income from continuing operations ......................................
Discontinued operations
Gain on discontinued division, net of $10,500
income taxes ..............................................................
Income before extraordinary item..........................................
Extraordinary item
Extraordinary loss, net of $21,000 income tax saving ......
Net income...............................................................................
quest2096813ent
quest2096813
asnmt967525
take-question
$290,000
24,500
314,500
(49,000)
$265,500
a
Exercise 14-13
Your answer is correct.
Maulder Corporation has income from continuing operations of $290,000 for the year ended December 31, 2014. It
also has the following items (before considering income taxes).
1.
An extraordinary loss of $70,000.
2.
A gain of $35,000 on the discontinuance of a division.
3.
A correction of an error in last year’s financial statements that resulted in a $25,000 understatement of 2013 net
income.
Assume all items are subject to income taxes at a 30% tax rate.
Prepare an income statement, beginning with income from continuing operations.
MAULDER CORPORATION
Partial Income Statement
For the Year Ended December 31, 2014
Income From Continuing Operations
EAT_1326366279
Discontinued Operations
EAT_1326366279
Gain on Discontinued Division
EAT_1326366279
Income Before Extraordinary Item
EAT_1326366279
Extraordinary Item
EAT_1326366279
Extraordinary Loss
Net Income / (Loss)
$
24500
314500
EAT_1326366279
EAT_1326366279
Click here if you would like to Show Work for this question
290000
49000
$
265500
Question Attempts: 1 of 3 used
PROBLEM 14-6
(a) Current ratio =
$204,000
= 1.5:1.
$134,000
(b) Acid-test ratio =
$21,000 + $18,000 + $85,000
= 0.93:1.
$134,000
$500,000
($85,000 + $75,000)
2
= 6.3 times.
(c) Accounts receivable turnover =
(d) Inventory turnover =
(e) Profit margin ratio =
$315,000
= 4.5 times.
$80,000 + $60,000
2
$36,700
= 7.3%.
$500,000
(f)
Asset turnover =
$500,000
= 0.8 times.
$627,000 + $551,000
2
(g) Return on assets =
$36,700
= 6.2%.
$627,000 + $551,000
2
$36,700
$373,000 + $350,000
2
= 10.2%.
(h) Return on common stockholders’ equity =
(i)
Earnings per share =
$36,700
= $1.22.
30,000 (1)
(1) $150,000 ÷ $5.00
(j)
Price-earnings ratio =
(k) Payout ratio =
$19.50
= 16.0 times.
$1.22
$13,700 (2)
= 37.3%.
$36,700
(2) $200,000 + $36,700 – $223,000
(l)
Debt to total assets =
$254,000
= 40.5%.
$627,000
(m) Times interest earned =
$64,200 (3)
= 8.6 times.
$7,500
(3) $36,700 + $20,000 + $7,500
quest2096823ent
quest2096823
asnmt967525
take-question
a
Problem 14-6A
Your answer is correct.
The comparative statements of Beulah Company are presented below.
BEULAH COMPANY
Income Statement
For the Years Ended December 31
2014
Net sales (all on account)
2013
$500,000
$420,000
Cost of goods sold
315,000
254,000
Selling and administrative
120,800
114,800
Expenses
Interest expense
Income tax expense
Total expenses
Net income
7,500
6,500
20,000
15,000
463,300
390,300
$ 36,700
$ 29,700
BEULAH COMPANY
Balance Sheets
December 31
Assets
2014
2013
Current assets
Cash
$ 21,000
$ 18,000
Short-term investments
18,000
15,000
Accounts receivable (net)
85,000
75,000
Inventory
80,000
60,000
204,000
168,000
Total current assets
Plant assets (net)
Total assets
423,000
383,000
$627,000
$551,000
$122,000
$110,000
12,000
11,000
134,000
121,000
Liabilities and Stockholders’ Equity
Current liabilities
Accounts payable
Income taxes payable
Total current liabilities
Long-term liabilities
Bonds payable
120,000
80,000
254,000
201,000
Common stock ($5 par)
150,000
150,000
Retained earnings
223,000
200,000
373,000
350,000
$627,000
$551,000
Total liabilities
Stockholders’ equity
Total stockholders’ equity
Total liabilities and stockholders’ equity
Additional data:
The common stock recently sold at $19.50 per share.
Compute the following ratios for 2014. (Round Earnings per share and Acid-test ratio to 2 decimal places, e.g.
1.65, and all others to 1 decimal place, e.g. 6.8 or 6.8% .)
(a)
Current ratio
1.5
:1
(b)
Acid-test ratio
0.93
:1
(c)
Accounts receivable turnover
6.3
times
(d)
Inventory turnover
4.5
times
(e)
Profit margin
7.3
%
(f)
Asset turnover
0.8
times
(g)
Return on assets
6.2
%
(h)
Return on common stockholders’ equity
10.2
%
(i)
Earnings per share
(j)
Price-earnings ratio
16.0
times
(k)
Payout ratio
37.3
%
(l)
Debt to total assets
40.5
%
8.6
times
(m) Times interest earned
$
1.22
Click here if you would like to Show Work for this question
Question Attempts: 1 of 3 used
Copyright © 2000-2012 by John Wiley & Sons, Inc. or related companies. All rights reserved.


