12
Simple Linear Regression
and Correlation
Copyright © Cengage Learning. All rights reserved.
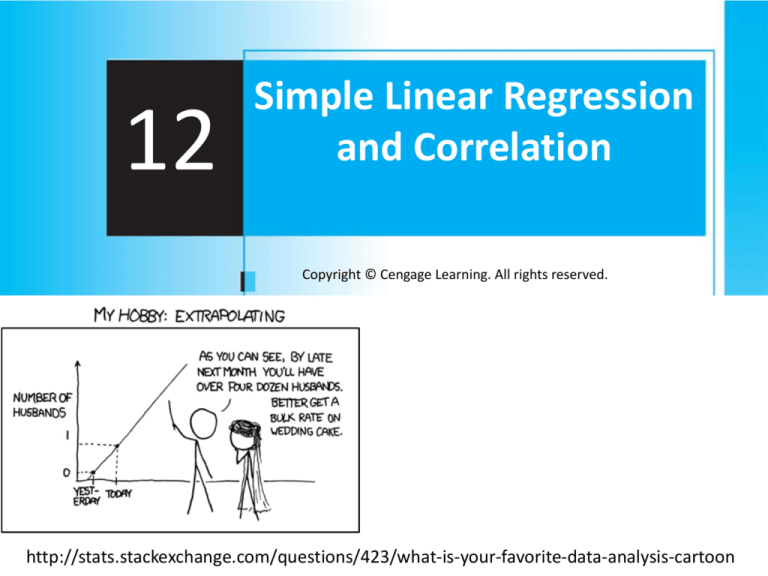
http://stats.stackexchange.com/questions/423/what-is-your-favorite-data-analysis-cartoon
Regression and Causality
http://stats.stackexchange.com/questions/10687/does-simple-linear-regression-imply-causation
Linear Regression: Definitions
X: predictor, explanatory, independent variable
Y: response, dependent variable
Example: Scatterplot
The following data is to determine the
relationship between age and change in
systolic blood pressure (BP, mm Hg) after 24
hours in response to a particular treatment.
a) Draw a scatterplot of this data.
Obs 1 2 3 4 5 6 7 8 9 10 11
Age 70 51 65 70 48 70 45 48 35 48 30
BP -28 -10 -8 -15 -8 -10 -12 3 1 -5 8
BP
BP
Example: Scatterplot (cont)
10
0
-10
-20
-30
10
0
-10
-20
-30
25
0
35
20
45
55
40
65
60
Age
Age
75
80
Error in the Regression Line
Distribution of Y
Linear Regression: Assumptions
1. There is a linear relationship between X and Y.
2. Each (X,Y) pair is random and independent of
the other pairs.
3. Variance of the residuals is constant.
Principle of Least Squares
Principle of Least Squares
Height of point – height of line = yi – (b0 +b1xi)
𝑛
𝑔 𝑏0 , 𝑏1 =
𝑦𝑖 − 𝑏0 + 𝑏1 𝑥𝑖
𝑖=1
𝜕𝑔(𝑏0 , 𝑏1 )
𝜕𝑔(𝑏0 , 𝑏1 )
= 0,
=0
𝜕𝑏0
𝜕𝑏1
2
Point Estimations
𝑏1 = 𝛽1 =
𝑏0 = 𝛽0 =
𝑆𝑥𝑦
𝑥𝑖 − 𝑥 𝑦𝑖 − 𝑦
=
2
𝑥𝑖 − 𝑥
𝑆𝑥𝑥
𝑦𝑖 − 𝑏1 𝑥𝑖
= 𝑦 − 𝑏1 𝑥
𝑛
Example: Least Squares
The following data is to determine the
relationship between age and change in
systolic blood pressure (BP, mm Hg) after 24
hours in response to a particular treatment.
a) What is the regression line for this data?
x̄ = 52.727, ȳ = -7.636, Sxy = -1055.909,
Sxx = 2006.182
Example: Least Squares (cont)
10
BP
0
-10
-20
-30
25
35
45
55
Age
65
75
Extrapolation
http://www.sciencedirect.com/science/article/pii/S001021800900114X
Example: Least Squares point estimate
The following data is to determine the
relationship between age and change in
systolic blood pressure (BP, mm Hg) after 24
hours in response to a particular treatment.
c) What is the point estimate for the change in
BP for someone who is 56 years old? 51 years
old?
d) What is the residual at this age 51? The
actual data point is (51, -10).
ANOVA Table
Source
df
SS
Model
(Regression)
1
𝑦𝑖 − 𝑦
Error
Total
n-2
𝑦𝑖 − 𝑦𝑖
n-1
𝑦𝑖 − 𝑦
MS
2
2
2
SSM
𝑆𝑆𝐸
𝑑𝑓𝑒
= 𝑆𝑦𝑦
=
𝑆𝑆𝐸
𝑛−2
Meaning of σ2
Meaning of R2
Cautions about R2
1.
2.
3.
4.
Linearity
Association
Outliers
Prediction
Example: Least Squares point estimate
The following data is to determine the
relationship between age and change in
systolic blood pressure (BP, mm Hg) after 24
hours in response to a particular treatment.
e) What proportion of the observed variation in
y can be attributed to the simple linear
regression relationship between x and y?
Example: Least Squares (cont)
10
BP
0
-10
outlier?
-20
-30
25
35
45
55
Age
65
75
Inference on the slope
http://www.biomedware.com/files/documentation/spacestat/interface/Views/
Regression_line.htm
Normality of Y
𝑥𝑖 − 𝑥 𝑦𝑖 − 𝑦
𝑏1 =
𝑥𝑖 − 𝑥 2
𝑥𝑖 − 𝑥 𝑦𝑖
𝑥𝑖 − 𝑥 𝑦
=
−
𝑆𝑥𝑥
𝑆𝑥𝑥
𝑥𝑖 − 𝑥 𝑦𝑖
𝑥𝑖 − 𝑥 𝑦𝑖
=
−0=
𝑆𝑥𝑥
𝑆𝑥𝑥
2
𝜎
2
𝜎𝑏1 =
𝑆𝑥𝑥
𝑠
𝑀𝑆𝐸
𝜎𝑏1 =
=
𝑆𝑥𝑥
𝑆𝑥𝑥
Example: Regression
The cetane number is a critical property in specifying the
ignition quality of a fuel used in a diesel engine.
Determination of this number for a biodiesel fuel is
expensive and time-consuming. Therefore a way of
predicting this number is wanted. The data on the next
slide is x = iodine value (g) and y = cetane number for a
sample of 14 biofuels. The iodine value is the amount
of iodine necessary to saturate a sample of 100g of oil.
Sxx = 6802.7693, Sxy = -1424.41429, x̄ = 93.393, ȳ = 55.657,
SSE = 78.920, SST = 377.174
a) What is the estimated regression line (besides the
equation of the line, include R2)?
Example: Scatterplot
cetane number
65
60
55
50
45
50
70
90
Iodine (g)
110
130
Example (Example 12.4): CI
The cetane number is a critical property in specifying
the ignition quality of a fuel used in a diesel engine.
Determination of this number for a biodiesel fuel is
expensive and time-consuming. Therefore a way of
predicting this number is wanted. The data on the
next slide is x = iodine value (g) and y = cetane
number for a sample of 14 biofuels. The iodine
value is the amount of iodine necessary to saturate
a sample of 100g of oil.
Sxx = 6802.7693, Sxy = -1424.41429, x̄ = 93.393, ȳ = 55.657,
SSE = 78.920, SST = 377.174
b) What is the 95% CI for the true slope?
β1 Hypothesis test: Summary
Example (Example 12.4): Hypothesis test
The cetane number is a critical property in specifying
the ignition quality of a fuel used in a diesel engine.
Determination of this number for a biodiesel fuel is
expensive and time-consuming. Therefore a way of
predicting this number is wanted. The data on the
next slide is x = iodine value (g) and y = cetane
number for a sample of 14 biofuels. The iodine
value is the amount of iodine necessary to saturate
a sample of 100g of oil.
c) Is the model useful (that is, is there a useful linear
relationship between x and y)?
ANOVA Table
Source
df
SS
Model
(Regression)
1
𝑦𝑖 − 𝑦
Error
Total
n-2
𝑦𝑖 − 𝑦𝑖
n-1
𝑦𝑖 − 𝑦
MS
2
2
2
SSM
𝑆𝑆𝐸
𝑑𝑓𝑒
= 𝑆𝑦𝑦
=
𝑆𝑆𝐸
𝑛−2
12.4
Inferences Concerning Y x and the
Prediction of Future Y Values
Copyright © Cengage Learning. All rights reserved.
Hypothesis test: Summary
Example (12.4): Hypothesis test for
The cetane number is a critical property in specifying the
ignition quality of a fuel used in a diesel engine.
Determination of this number for a biodiesel fuel is
expensive and time-consuming. Therefore a way of
predicting this number is wanted. The data on the next
slide is x = iodine value (g) and y = cetane number for a
sample of 14 biofuels. The iodine value is the amount
of iodine necessary to saturate a sample of 100g of oil.
d) Is the model useful (that is, is there a useful linear
relationship between x and y) using the population
correlation coefficient?
SSE = 78.9192, SST = Syy = 377.1743
Sxx = 6502.7693, Sxy = -1424.41429
Good
Residual Plots
Linearity Violation
Good
Residual Plots
Constant variance violation
Residual
Plots
Example: SLR 1 – Residual Plot
Example: SLR 1 – Normality


