Age/Sex Structure - CAPEenvironmentalscience
advertisement
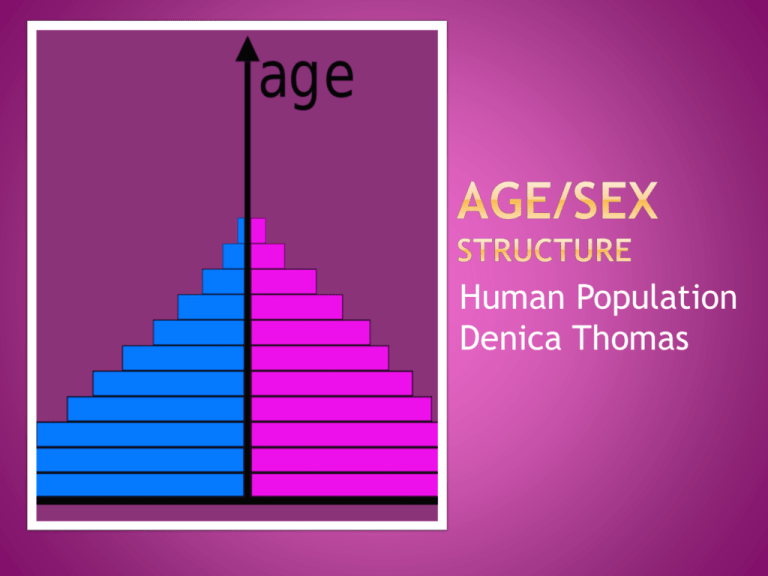
Human Population Denica Thomas Define Age/Sex Structure. How to construct and interpret an Age/Sex Structure. Uses of Age/Sex Structure Diagrams. The age/sex structure is also called the Population Pyramid. This Structure or Pyramid is a graphic way to show the age and sex composition of a population. The sum of all age and sex groups equals 100 percent of the population. With age and sex distribution data from a certain population, it is easy to construct an age structure diagram. Once the diagram is constructed, one can clearly see if the population will grow, decline, or experience no noticeable change in its population number. for example, if the diagram shows a pyramidal shape, then one can expect a rapid rise in population. If the diagram shows a generally straight up and down shape except for the older age groups, a stable population is thus revealed. If the diagram shows a top-heavy shape, then a decline is forecast for that population. Scotland Age/Sex structure diagram(pyramidal Shape) Japan Age/ Sex structure(Top Heayy shape) The developing countries have a population structure that resembles a pyramid with a broad base of young and a small apex of old. Sudan in 1995 is an example of a pyramid for a developing country. The developed countries are beginning to lose their "pyramidal" shape as they become more straight up and down with almost equal numbers of people in adjacent age groups until the ages of high death rates begin after age 65. United States in 1995 is an example of a pyramid for a developed country. Population pyramids can be used to find the number of economic dependents being supported in a particular population. Economic dependents are defined as those under 15 (children who are in full time education and therefore unable to work) and those over 65 (those who have the option of being retired). In many countries, the government plans the economy in such a way that the working population can support these dependents. Age pyramid has similar uses to population pyramid. Population pyramids can be used to observe the natural increase, birth, and death rate.


