lab_assignment_1
advertisement
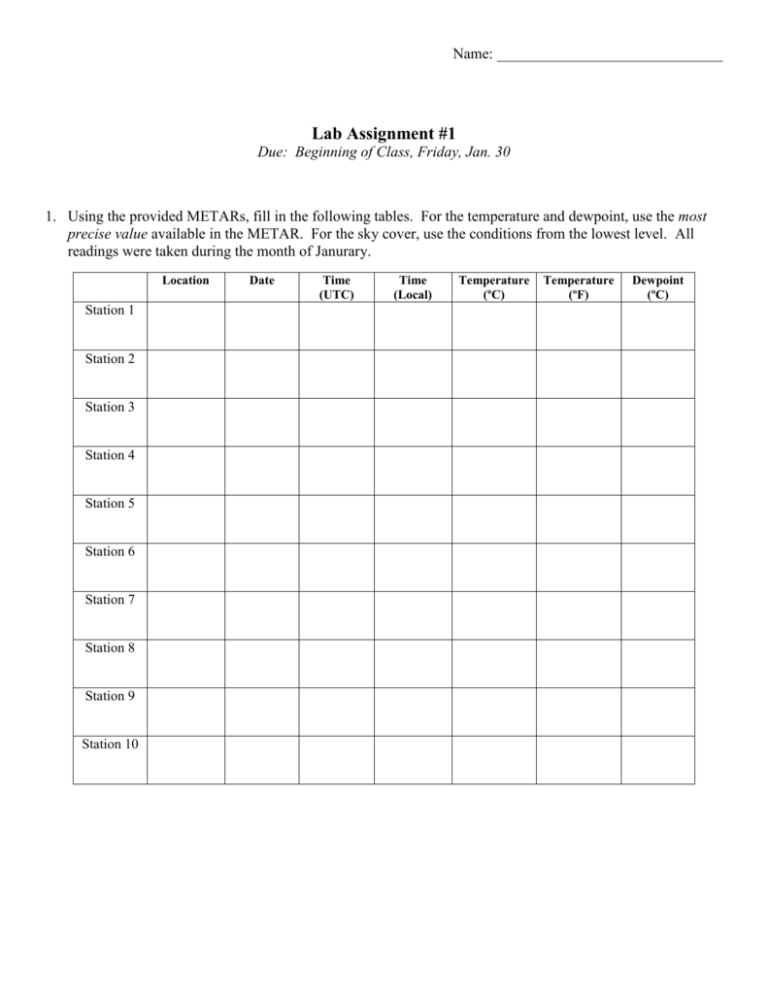
Name: ______________________________ Lab Assignment #1 Due: Beginning of Class, Friday, Jan. 30 1. Using the provided METARs, fill in the following tables. For the temperature and dewpoint, use the most precise value available in the METAR. For the sky cover, use the conditions from the lowest level. All readings were taken during the month of Janurary. Location Station 1 Station 2 Station 3 Station 4 Station 5 Station 6 Station 7 Station 8 Station 9 Station 10 Date Time (UTC) Time (Local) Temperature (ºC) Temperature (ºF) Dewpoint (ºC) Barometric Pressure (mb) Station 1 Station 2 Station 3 Station 4 Station 5 Station 6 Station 7 Station 8 Station 9 Station 10 Precipitation Type Sky Cover (Eighths or Tenths) Wind Direction (degrees) Wind Speed (knots) Station 1 KMOB 121956Z 32012G19KT 10SM SCT027 SCT120 BKN200 14/05 A2989 RMK AO2 SLP121 T01390050 Station 2 KHSV 121953Z 28015G22KT 3SM -RA BR FEW010 OVC017 02/M01 A2975 RMK AO2 PK WND 29029/1911 RAB10 SLP076 P0000 T00171006 Station 3 KHSV 111004Z 12003KT 2SM +TSRA BR SCT012CB OVC039 14/14 A2955 RMK AO2 OCNL LTGICCCCG NE-SE-S TS NE-SE-S MOV N P0013 Station 4 KDEN 121253Z 22009KT 10SM CLR M11/M19 A3006 RMK AO2 SLP243 T11061189 $ Station 5 KGUS 122021Z 25019G25KT 1SM R23/4500VP6000FT -SN BR OVC008 M05/M05 A2944 RMK AO2A SLP979 Station 6 KMIA 100953Z 00000KT 10SM FEW037 17/14 A3008 RMK AO2 SLP186 T01720144 Station 7 KDFW 101653Z 29011KT 1 1/2SM R17C/5000V6000FT -RA BR OVC007 06/05 A2992 RMK AO2 SFC VIS 1 3/4 RAB44 SLP132 P0000 T00610050 $ Station 8 KMSP 111853Z 30016G23KT 2 1/2SM -SN BR FEW010 BKN019 OVC040 00/M02 A2971 RMK AO2 PK WND 32030/1828 RAE18 SLP069 P0000 T00001017 Station 9 KMIE 122053Z 26016G27KT 2 1/2SM -SN SCT018 BKN036 OVC048 M05/M08 A2947 RMK AO2 PK WND 26027/2050 SLP983 P0000 60000 T10501083 53014 Station 10 KOKC 121352Z 30016G23KT 10SM CLR M06/M16 A3016 RMK AO2 SLP225 T10561161 2. Using the station models below, decode the weather conditions and record the information in the table which follows: Weather Element Temperature (ºF) Temperature (ºC) Barometric Pressure (mb) Precipitation Type Percent Sky Cover Wind Direction Wind Speed (knots) Station 1 Station 2 Station 3 Station 4 Station 5 3. Something is incorrect about the station models plotted in #2. Describe what you believe is wrong. 4. Draw 5 separate station models using the information provided in METAR stations 3, 4, 7, 8 and 10. You do not have to include the barometric trend in your models. 5. Study the weather stations shown below. Write the letter (or letters) of the weather station(s) next to each description of the conditions. a. Wind NW at 40 miles per hour: _______________________________________ b. Wind SE at 15 miles per hour: _______________________________________ c. Overcast: _______________________________________ d. Clear sky: _______________________________________ e. Thunderstorm: _______________________________________ f. Closest to the warm front: _______________________________________ g. Closest to the cold front: _______________________________________ Helpful Information Air Pressure: when coding air pressure on a station model, use the following rule: a. if the air pressure on the station model is 500 or more, place a 9 in front of this number. Also, put a decimal point in front of the last number. EX: 588 – 958.8 mb b. if the air pressure on the station model is less than 500 add a 10 in front of the number. Also, put a decimal point in front of the last number. EX: 091 – 1009.1 mb Past Pressure: when calculating the air pressure for three hours previous use the following rule: a. if the station model displays a + some number there was an increase in the barometric pressure. Place a decimal between the 2 digits and subtract the number from the current air pressure to get the pressure from 3 hours ago. EX: +12 = 1.2 mb increase so the past pressure is lower by 1.2 mb b. if the station model displays a – some number there was a decrease in the barometric pressure. Place a decimal between the 2 digits and add the number to the current air pressure to get the pressure from 3 hours ago. EX: -24 = 2.4 mb decrease so the past pressure is higher by 2.4 mb Temperature and dewpoint are always reported in degrees Fahrenheit (ºF) on station models, but in degrees Celsius (ºC) on METAR reports. Wind direction is measured by where the wind originates. The stick of the station models points in the direction of where the wind comes from. The flags on the stick approximate the speed of the wind, a short flag: 5 knots, a long flag: 10 knots, and a triangle: 50 knots. 1 knot = 1.85 km/hr or 1.2 mph Cloud cover is determined by how much of the visible sky is filled with clouds. (Usually in oktas = eighths, sometimes in tenths).
