Unit 5 Lab - Dado Science
Bonding
Lab: Club Fuego and the Case of Intermolecular Forces
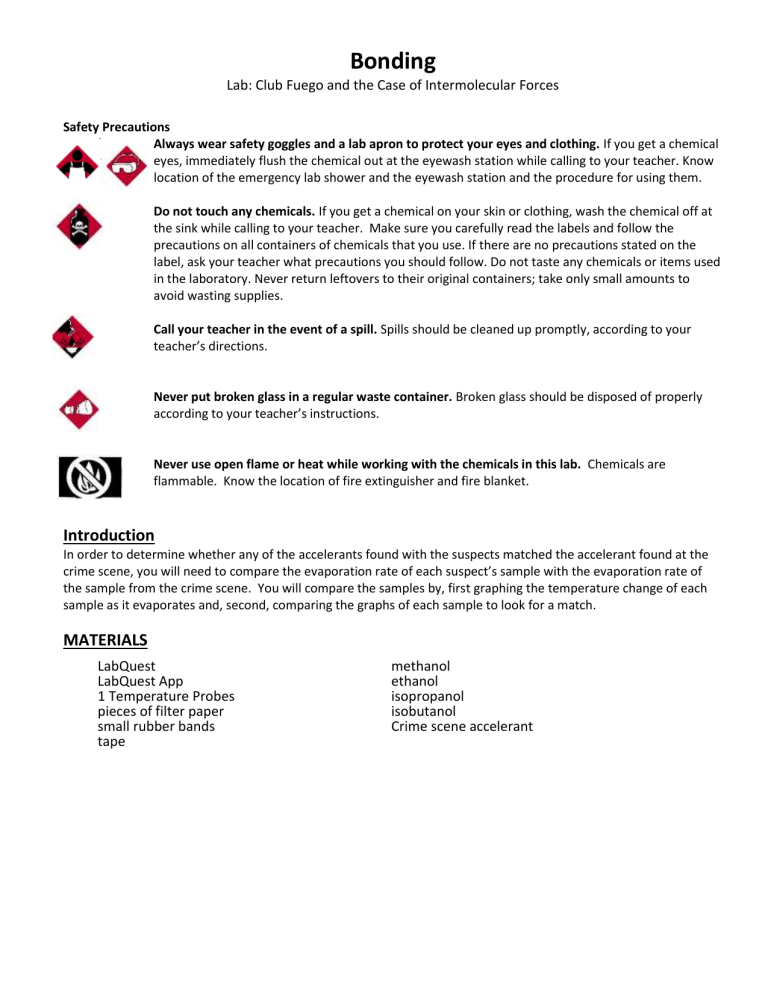
Safety Precautions
Always wear safety goggles and a lab apron to protect your eyes and clothing. If you get a chemical in your the eyes, immediately flush the chemical out at the eyewash station while calling to your teacher. Know location of the emergency lab shower and the eyewash station and the procedure for using them.
Do not touch any chemicals. If you get a chemical on your skin or clothing, wash the chemical off at the sink while calling to your teacher. Make sure you carefully read the labels and follow the precautions on all containers of chemicals that you use. If there are no precautions stated on the label, ask your teacher what precautions you should follow. Do not taste any chemicals or items used in the laboratory. Never return leftovers to their original containers; take only small amounts to avoid wasting supplies.
Call your teacher in the event of a spill. Spills should be cleaned up promptly, according to your teacher’s directions.
Never put broken glass in a regular waste container. Broken glass should be disposed of properly according to your teacher’s instructions.
Never use open flame or heat while working with the chemicals in this lab. Chemicals are flammable. Know the location of fire extinguisher and fire blanket.
Introduction
In order to determine whether any of the accelerants found with the suspects matched the accelerant found at the crime scene, you will need to compare the evaporation rate of each suspect’s sample with the evaporation rate of the sample from the crime scene. You will compare the samples by, first graphing the temperature change of each sample as it evaporates and, second, comparing the graphs of each sample to look for a match.
MATERIALS
LabQuest
LabQuest App
1 Temperature Probes pieces of filter paper small rubber bands tape methanol ethanol isopropanol isobutanol
Crime scene accelerant
PROCEDURE
1.
Obtain and wear goggles! CAUTION: The compounds used in this experiment are flammable and poisonous. Avoid inhaling their vapors. Avoid contacting them with your skin or clothing. Be sure there are no open flames in the lab during this experiment. Notify your teacher immediately if an accident occurs.
2.
Connect the Temperature Probes to LabQuest and choose New from the File menu. If you have older sensors that do not auto-ID, manually set up the sensors.
3.
On the Meter screen, tap Length. Change the data-collection length to 240 seconds. Select OK. Data collection will last 4 minutes.
4.
Wrap the temperature probe with square pieces of filter paper secured by small rubber bands as shown in the left section of Figure 1. Roll the filter paper around the probe tip in the shape of a cylinder.
Figure 1
5.
Stand Probe 1 in the first container. Make sure the containers do not tip over.
6.
Prepare a piece of tape to be used to tape the probe in position during Step 7 (as shown in the right hand side of Figure 1).
7.
After the probes have been in the liquids for at least 30 seconds, start data collection. A live graph of temperature vs. time for Probe 1 is being plotted on the screen. Live readings are displayed to the right of the graph. Monitor the temperature for 15 seconds to establish the initial temperature of each liquid. Then remove the probe from the liquids and tape them so the probe tip extend 5 cm over the edge of the table top as shown in the right hand side of Figure 1.
8.
Data collection will stop after 4 minutes (or stop data collection before 4 minutes has elapsed). Examine the graph of temperature vs. time. Based on your data, determine the maximum temperature, t
1 and record it in your data table. (Use the stylus to help you determine those temperatures.
9.
Carefully take off the rubber band (or it could splatter) and remove the filter paper. Wipe off the temperature probe and then repeat steps 4-8 until all samples have been taken.
10.
the temperature change during evaporation. Record this in your data table.
11.
Compare the data to determine which of the suspects had an accelerant that is likely to be the same as the accelerant used at the crime scene. If one of the suspects’ accelerants produces data that from the crime scene accelerant, it could be the accelerant that was used.
Cleanup and Disposal
12.
Clean all apparatus and your lab station. Return equipment to its proper place. Dispose of all chemicals and waste as directed by your teacher. Wash your hands thoroughly after all work is finished and before you leave the lab.
Lab: Intermolecular Forces
Suspect/Substance
Evaporation and Intermolecular Attractions
Data Table 1: Evaporation Rate
Lewis Structure
T max
(°C)
T min
(°C)
Tmax-
Tmin
(°C)
Cooling
Rate
Graph
Match?
Suspect
Name
Suspect 1 acetone
CH
3
COCH
3
Suspect 2 methanol
CH
3
OH
Suspect 3 isopropanol
(CH
3
)
2
CHOH
Suspect 4 isobutanol
(CH
3
)
2
CHCH
2
OH
Crime Scene N/A
Analysis
1.
Draw dipoles on the molecules in the Lewis structures above where appropriate.
2.
Does the suspect’s sample that you tested match the sample that you tested from the crime scene? How can you tell? If your sample does not match, compare your results with the results of other groups to determine which suspect’s sample matches the sample from the crime scene.
3.
Why may the graphs of the crime scene accelerant and primary suspect’s accelerant not match exactly?
Chemistry with Vernier 9 - 3
4.
Which of the compounds exhibit hydrogen bonding as a type of intermolecular force? Which do not?
5. London dispersion forces are a type of intermolecular force that occurs between all atoms and molecules whether they are polar or not. Which molecule exhibits the strongest London dispersion forces? Which molecule exhibits the weakest? How can you tell?
Boiling Point
6. Examine the graph above. It shows hydrogen bonded to elements in the fourth, fifth, sixth and seventh groups of the main block on the periodic table. Why is the boiling point of H
2
O, HF, and NH
3
unusually high?
7. Examine the graph above. Why doesn’t CH
4 also have an unusually high boiling point?
