8th Grade Math Week of February 8th
advertisement
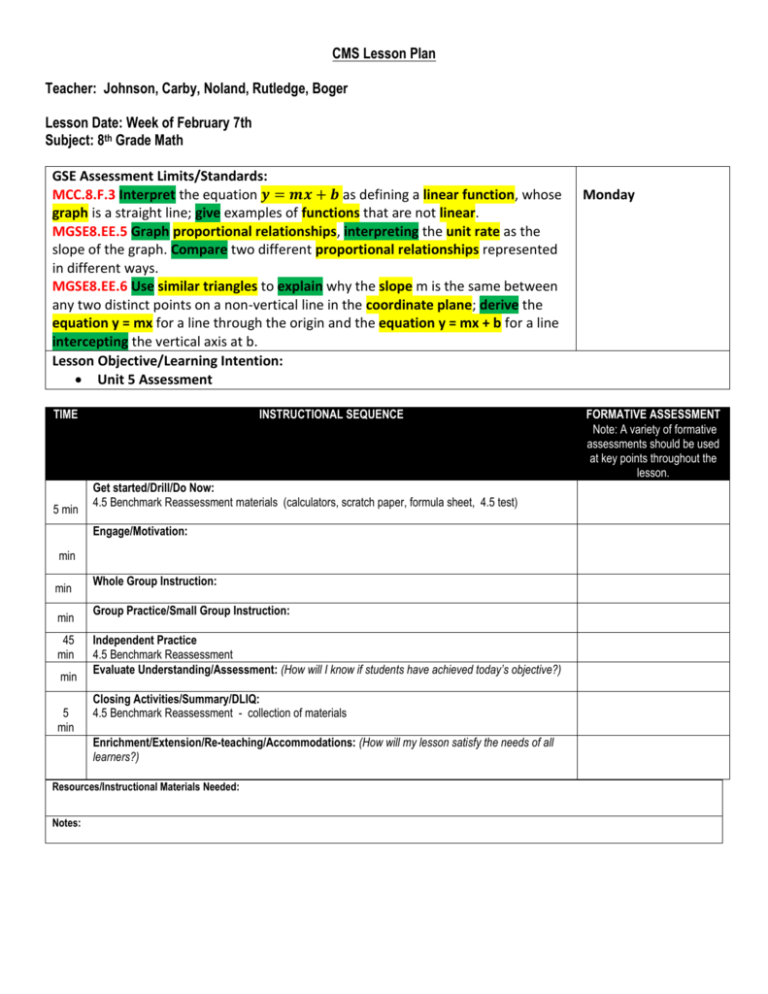
CMS Lesson Plan Teacher: Johnson, Carby, Noland, Rutledge, Boger Lesson Date: Week of February 7th Subject: 8th Grade Math GSE Assessment Limits/Standards: MCC.8.F.3 Interpret the equation 𝒚 = 𝒎𝒙 + 𝒃 as defining a linear function, whose graph is a straight line; give examples of functions that are not linear. MGSE8.EE.5 Graph proportional relationships, interpreting the unit rate as the slope of the graph. Compare two different proportional relationships represented in different ways. MGSE8.EE.6 Use similar triangles to explain why the slope m is the same between any two distinct points on a non-vertical line in the coordinate plane; derive the equation y = mx for a line through the origin and the equation y = mx + b for a line intercepting the vertical axis at b. Lesson Objective/Learning Intention: Unit 5 Assessment TIME 5 min INSTRUCTIONAL SEQUENCE Get started/Drill/Do Now: 4.5 Benchmark Reassessment materials (calculators, scratch paper, formula sheet, 4.5 test) Engage/Motivation: min min min 45 min min 5 min Whole Group Instruction: Group Practice/Small Group Instruction: Independent Practice 4.5 Benchmark Reassessment Evaluate Understanding/Assessment: (How will I know if students have achieved today’s objective?) Closing Activities/Summary/DLIQ: 4.5 Benchmark Reassessment - collection of materials Enrichment/Extension/Re-teaching/Accommodations: (How will my lesson satisfy the needs of all learners?) Resources/Instructional Materials Needed: Notes: Monday FORMATIVE ASSESSMENT Note: A variety of formative assessments should be used at key points throughout the lesson. Structure Whole Group Guided Practice/Small group Independent Practice Instructional Strategies Used- Please highlight, bold, or underline -Anticipatory guides/sets -Close Reading -Text annotation - Graphic Organizer -Anticipatory guides/sets -Close Reading -Question-Answer-Relationships (QAR) -Strategy groups -Think/Pair/Share -Anticipatory guides/sets -Close Reading -Question-Answer-Relationships (QAR) -Strategy groups -Think/Pair/Share -Book/author talks -Questioning the Author (QtA) -Think aloud -Cornell Notes -Question-Answer-Relationships (QAR) -Think/Pair/Share -Book/author talks -Literature Circles -Reading conferences -Text annotation -Writing Conferences -Book/author talks -Literature Circles -Reading conferences -Text annotation -Writing Conferences -Cornell Notes -Questioning the Author (QtA) -Reciprocal teaching -Think aloud -Cornell Notes -Questioning the Author (QtA) -Reciprocal teaching -Think aloud -Problem Solving GSE Assessment Limits/Standards: MGSE8.F.4 Construct a function to model a linear relationship between two Tuesday/Wednesday quantities. Determine the rate of change and initial value of the function from a description of a relationship or from two (x, y) values, including reading these from a table or from a value of a linear function in terms of the situation it models, and in terms of its graph or a table of values. MGSE8.F.5 Describe qualitatively the functional relationship between two quantities by analyzing a graph (e.g., where the function is increasing or decreasing, linear or nonlinear). Sketch a graph that exhibits the qualitative features of a function that has been described verbally. MGSE8.SP.1 Construct and interpret scatter plots for bivariate measurement data to investigate patterns of association between two quantities. Describe patterns such as clustering, outliers, positive or negative association, linear association, and nonlinear association. Lesson Objective/Learning Intention: SWBAT: Recognize that the y-intercept is the initial value where x = 0 SWBAT: Construct a function to model a linear relationship between two quantities SWBAT: Construct scatter plots for bivariate measurement data TIME INSTRUCTIONAL SEQUENCE Get started/Drill/Do Now: 10 min 5 min Engage/Motivation: LearnZillion - Video Tutorial (MGSE8.F.4) Students will reflect on the notes taken during the video 30 min Whole Group Instruction: Students will work through various problems in class that challenge them to construct a function when given a table, graph, or verbal description FORMATIVE ASSESSMENT Note: A variety of formative assessments should be used at key points throughout the lesson. min Group Practice/Small Group Instruction: Independent Practice Students will work through various problems in class that challenge them to construct a function when given a table, graph, or verbal description 30 min Evaluate Understanding/Assessment: (How will I know if students have achieved today’s objective?) Students will turn in their work to check for understanding. 10 min 5 min Closing Activities/Summary/DLIQ: SUMMARIZE: 3-2-1 Strategy Enrichment/Extension/Re-teaching/Accommodations: (How will my lesson satisfy the needs of all learners?) The teacher will provide skeleton notes and will scaffold Guided Practice and independent practice questions. Resources/Instructional Materials Needed: SKILLS PRACTICE - Representing Relationships PROBLEM SOLVING - Representing Relationships SKILLS PRACTICE - Constructing Functions PROBLEM SOLVING - Constructing Functions Notes: Structure Whole Group Guided Practice/Small group Independent Practice Instructional Strategies Used- Please highlight, bold, or underline -Anticipatory guides/sets -Close Reading -Text annotation - Graphic Organizer -Anticipatory guides/sets -Close Reading -Question-Answer-Relationships (QAR) -Strategy groups -Think/Pair/Share -Anticipatory guides/sets -Close Reading -Question-Answer-Relationships (QAR) -Strategy groups -Think/Pair/Share -Book/author talks -Questioning the Author (QtA) -Think aloud -Cornell Notes -Question-Answer-Relationships (QAR) -Think/Pair/Share -Book/author talks -Literature Circles -Reading conferences -Text annotation -Writing Conferences -Book/author talks -Literature Circles -Reading conferences -Text annotation -Writing Conferences -Cornell Notes -Questioning the Author (QtA) -Reciprocal teaching -Think aloud -Cornell Notes -Questioning the Author (QtA) -Reciprocal teaching -Think aloud -Problem Solving GSE Assessment Limits/Standards: MGSE8.SP.1 Construct and interpret scatter plots for bivariate measurement data to investigate patterns of association between two quantities. Describe patterns such as clustering, outliers, positive or negative association, linear association, and nonlinear association. Thursday/ Friday MGSE8.SP.2 Know that straight lines are widely used to model relationships between two quantitative variables. For scatter plots that suggest a linear association, informally fit a straight line, and informally assess the model fit by judging the closeness of the data points to the line. Lesson Objective/Learning Intention: SWBAT: Informally asses the model fit by judging the closeness of the data points to the line SWBAT: Fit a straight line within the plotted data TIME INSTRUCTIONAL SEQUENCE FORMATIVE ASSESSMENT Note: A variety of formative assessments should be used at key points throughout the lesson. Get started/Drill/Do Now: 15 min 5 min 35 min min 30 min min 15 min Engage/Motivation: LearnZillion - Video Tutorial (MGSE8.SP.1) Students will take notes on the video and reflect on how we use bivariate data in real-life Whole Group Instruction: Students will work through various problems in class that challenge them to construct a line of best fit and interpret the meaning of it in context of the problem. Group Practice/Small Group Instruction: Independent Practice: Students will work through various problems in class that challenge them to construct scatter plots when given a table, graph, or verbal description Evaluate Understanding/Assessment: Closing Activities/Summary/DLIQ: Constructed Response - Line of Best Fit Assessment Enrichment/Extension/Re-teaching/Accommodations: (How will my lesson satisfy the needs of all learners?) The teacher will provide skeleton notes and will scaffold guided practice and independent practice questions Resources/Instructional Materials Needed: Powerpoint presentation, practice problems from the textbook Notes: PROBLEM SOLVING - Scatter Plots SKILLS PRACTICE - Scatter Plots PROBLEM SOLVING - Line of Best Fit SKILLS PRACTICE - Line of Best Fit Constructed Response - Line of Best Fit Structure Whole Group Guided Practice/Small group Independent Practice Instructional Strategies Used- Please highlight, bold, or underline -Anticipatory guides/sets -Close Reading -Text annotation -Anticipatory guides/sets -Close Reading -Question-Answer-Relationships (QAR) -Strategy groups -Think/Pair/Share -Anticipatory guides/sets -Close Reading -Question-Answer-Relationships (QAR) -Strategy groups -Think/Pair/Share -Book/author talks -Questioning the Author (QtA) -Think aloud -Book/author talks -Literature Circles -Reading conferences -Text annotation -Writing Conferences -Book/author talks -Literature Circles -Reading conferences -Text annotation -Writing Conferences -Cornell Notes -Question-Answer-Relationships (QAR) -Think/Pair/Share -Cornell Notes -Questioning the Author (QtA) -Reciprocal teaching -Think aloud -Cornell Notes -Questioning the Author (QtA) -Reciprocal teaching -Think aloud
