assessing hillslope response mechanisms using stable isotopes
advertisement
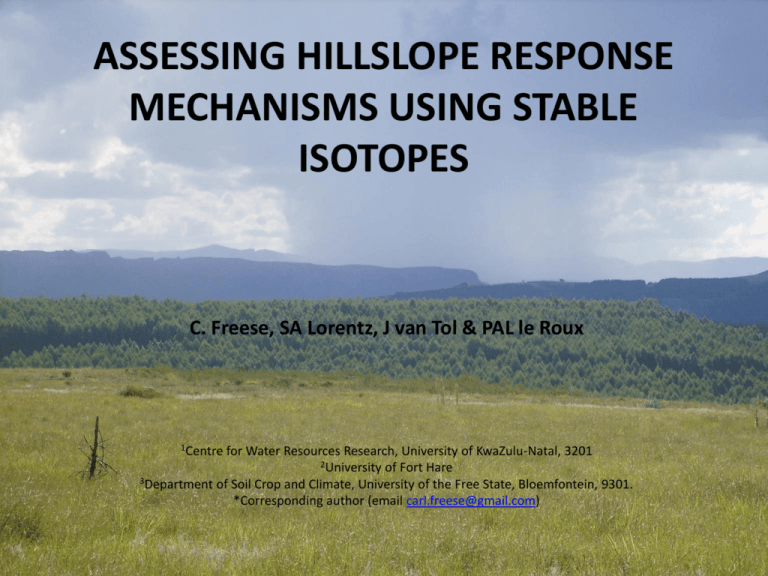
ASSESSING HILLSLOPE RESPONSE MECHANISMS USING STABLE ISOTOPES C. Freese, SA Lorentz, J van Tol & PAL le Roux 1Centre for Water Resources Research, University of KwaZulu-Natal, 3201 2University of Fort Hare 3Department of Soil Crop and Climate, University of the Free State, Bloemfontein, 9301. *Corresponding author (email carl.freese@gmail.com) Introduction Site specific nature of previous studies makes transfer to ungauged sites difficult due to: • • 1: Spatial and temporal complexity 2: Current lack of tools Residence time distribution equations • generalized descriptors of catchment hydrology • Spatially transferrable • Potentially low data intensity Develop generalized descriptors of subsurface for use in a catchment scale model • δ18O isotope data • two-step algorithm ( derive Dp and τ) • parameterize hillslope sub catchments in the ACRU Intermediate zone model • comparative ACRU simulations to assess the ability of Dp and τ Methodology Methodology Convolution integral relates the output isotope time series to the input isotope time series • simulating the probability distribution for a conservative tracer molecules Where: δ(t) = output δO18 signal t’ = integration parameter describing entry time of the tracer into the system t = calendar time δin = input δO18 signal g(t - t’) = residence time distribution Where: g(t) Dp τ = = = response function Dispersion coefficient mean response time. Where: N αi Pi δi δgw = = = = = number of time steps/samples recharge factor precipitation amount (mm) precipitation δO18 value (‰) ground water δO18 value (‰) Methodology Results δin 4 2 0 δO18 -2 -4 -6 -8 -10 04-Oct-09 13-Nov-09 input rfl 23-Dec-09 hillslope 1 hillslope 2 01-Feb-10 hillslope 3 13-Mar-10 hillslope 4 Results δ(t) 3 simulated 2 lc04 seep 1 4L δO18 0 -1 -2 -3 -4 -5 -6 01-Feb-09 08-Feb-09 15-Feb-09 22-Feb-09 01-Mar-09 08-Mar-09 3 simulated lc04 seep 4L 2 1 δO18 0 -1 -2 -3 -4 -5 -6 1-Feb-10 16-Feb-10 3-Mar-10 18-Mar-10 2-Apr-10 Results 3 simulated 2 uc 2A δO18 1 uc 2B 0 uc 01 -1 -2 -3 -4 -5 -6 1-Feb-10 16-Feb-10 3-Mar-10 18-Mar-10 2-Apr-10 3 2 simulated 1 uc 3/4 δO18 0 -1 -2 -3 -4 -5 -6 1-Feb-10 16-Feb-10 3-Mar-10 18-Mar-10 2-Apr-10 Results Hillslope Site Lower 1 catchmen t Upper 2 3 catchmen t 4 Date Dispersion Mean response time R2 coefficient (D) (τ) LC 04 February 2009 0.002 18 0.81 LC 04 March 2012 0.003 12 0.24 LC 08 February 2009 0.0015 12 - LC 08 March 2012 0.002 12 0.27 UC 01 February 2009 0.30 10 - UC 01 March 2012 0.30 10 0.19 UC3/4 February 2009 0.09 9 - UC3/4 March 2012 0.09 9 0.41 Results (ACRU 2000) 30 0 10 25 Discharge (mm) 20 30 15 40 R2= 0.68 10 50 60 5 70 0 80 rainfall simulated observed Rainfall (mm) 20 ACRU Intermediate zone model Results (ACRU Int) Results (ACRU Int) 0 10 25 20 20 30 15 R2= 0.71 10 40 50 60 5 70 0 80 rainfall simulated observed Rainfall (mm) Discharge (mm) 30 Conclusions • Low Dp high τ – event pulse responses of the lower catchment. • High Dp low τ – sustained drainage of upper catchment. • ACRU Int improvement on baseline simulations. – Peak flows (ACRU 2000 & Int) – Low flows (ACRU Int) – Improved simulation of soil water discharge to stream Proposal • Initial field setup/ maintainence – December 2014-February 2015 • Improved data sets – Analyse for a range of tracers (EC, silica, N etc.) – Temporal sampling density (tracers) • Rainfall • Streamflow • Soil water • Monitor Mooi hillslopes – Hillslopes across different geologies – Identify similar/typical hillslopes Proposal • Further ACRU Int testing – – – – Refine input data set (tracers) Increase detail of Weatherley simulations (more landsegments) Define typical hillslopes within certain parts of the Mooi Parameterise & model Mooi hillslopes • Further insight into transferability of Dp and τ – Capability to represent hydrological process across scales – Linked to existing classification systems
