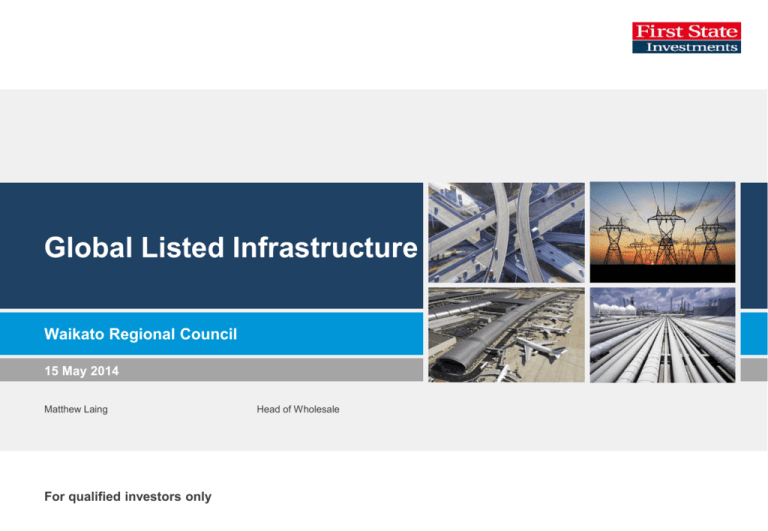
Global Listed Infrastructure
Waikato Regional Council
15 May 2014
Matthew Laing
For qualified investors only
Head of Wholesale
Investment proposition
Aim to deliver inflation-protected income and strong capital growth
Globally diversified portfolio of infrastructure securities:
Transport – roads, airports, ports and rail
Utilities – water, gas and electricity
Energy – oil and gas pipelines and storage
Communications – towers and satellites
Actively managed to preserve and grow capital:
On-the-ground due diligence
Specialist stock selection (80% bottom-up)
Sensible portfolio construction (20% top-down)
Focus on quality companies with mispricing
Source: iStockphoto
2
Listed Infrastructure team
Peter Meany
Andrew Greenup
Head of Listed Infrastructure
Experience: 18 / 7
Coverage: Energy Storage
Deputy Head
18 / 9
Integrated Utilities
Ports
Passenger Rail
Experienced
Specialists
Rebecca
Sherlock
Edmund
Leung
Ofer
Karliner
Jessica
Johnson
Pablo
Kohen
Trent
Koch
Senior Analyst
12 / 6
Regulated Utilities
Water and Waste
Senior Analyst
8/7
Airports
Towers
Satellites
Senior Analyst
18 / 3
Toll Roads
Energy Pipelines
Analyst
4/4
Regulated Utilities
Senior Analyst
12 / 2
Freight Rail
Regulated Utilities
Portfolio Manager
16 / 6
Energy Pipelines
Experience refers to years in Industry / with First State Investments
3
Global Listed Infrastructure business
Autonomous business with the significant resources of a global asset manager
Boutique culture with team profit share, incentives on long-term performance
Strong investment performance track record through challenging markets
Stable team and investment process
AuM around $4.5bn
• Institutional 57% / Wholesale 43%
• Separate 52% / Pooled 48%
Source: First State Investments as of March 31, 2014
Past performance is not an indication of future performance.
4
Performance
To 31 March 2014
Performance (% before fees and expenses)
3 months
1 year
3 years pa
5 years pa
Since inception
Fund*
7.3%
20.8%
16.9%
21.0%
7.7%
Benchmark**
6.5%
18.4%
15.3%
17.2%
4.2%
Active performance
+0.8%
+2.4%
+1.5%
+3.8%
+3.5%
Financial year end 30 June.
*Colonial First State Wholesale Global Listed Infrastructure Securities Fund (AUD Hedged) ^MSCI World Net TR Index (AUD Hedged)
**The benchmark from inception was the S&P Global Infrastructure Index AUD Hedged, from 01/05/08 the UBS Global Infrastructure & Utilities 50-50 Net TR Index (AUD hedged)
Source: First State Investments
Past performance is not an indication of future performance.
5
Competitive strengths
Specialists
Quality
Disciplined
Active
Aligned
Resourced
•
Experienced team, sector coverage to maximise knowledge and identify
global best practice, over 500 company visits per year
•
•
Assets with barriers to entry, structural growth, pricing power
Companies with management alignment, board independence, appropriate
gearing, sustainable culture
•
Proprietary research, consistent valuation framework, comprehensive quality
assessment, consideration of macro risks
•
Direct contact with companies and regulators, high conviction portfolios,
sensible macro overlays, search for mispricing
•
Strong sense of portfolio ownership, team members invested in fund,
incentives on long-term fund performance
•
Global network of over 230 investment professionals, financial strength of
the Commonwealth Bank of Australia
6
Benefits of Global Listed Infrastructure
Reliable income
Infrastructure has delivered a reliable yield of around 4% pa
Most sectors have the capacity to pay higher dividends or buyback shares
Balance sheets are in good shape with low leverage and long debt maturities
8
Inflation protection
Most infrastructure assets can increase prices with inflation due to concession
agreements, regulatory regimes or limited competition
In periods when CPI has exceeded 4%, infrastructure has outperformed by 10% pa
Source: First State Investments. Past performance is not an indication of future performance.
9
Sources of growth
Infrastructure has growth characteristics that bonds don’t
“Income” infrastructure sectors have a steadily growing coupon
“Growth” infrastructure can benefit from improving economic conditions
10
Demand for scarce infrastructure assets
Infrastructure developing into an asset class in its own right
Pension funds materially underweight versus target allocations
Unlisted funds have US$80bn ready to invest but a scarcity of options
11
Portfolio analysis
Portfolio weights
Source: CFSGAM
Source: CFSGAM
Colonial First State Wholesale Global Listed Infrastructure Securities Fund as of March 31, 2014. All data in local currency terms.
Fund is not available for investment by US persons.
Any fund or stock mentioned in this presentation does not constitute any offer or inducement to enter into any investment activity
Source: First State Investments
13
Portfolio analytics
Top 10 holdings
Sector
% Portfolio
Portfolio Metrics
Vinci
Toll Roads
7.0%
Number of stocks
41
Transurban
Toll Roads
5.2%
Average Market Cap (US$bn)
21
SSE
Integrated Utilities
4.9%
PPL Corp
Regulated Utilities
4.3%
EV / EBITDA
East Japan Railway
Passenger Rail
4.1%
Price / Earnings
Asciano
Freight Rail
4.0%
Price / Book
Crown Castle International Towers
4.0%
Dividend Yield (gross)
3.5%
National Grid
Regulated Utilities
3.9%
American Tower
Towers
3.3%
Payout ratio
53%
Eutelsat
Satellites
3.1%
Net Debt / EBITDA
2.9x
43.8%
Return On Equity
12%
Top 10
Colonial First State Wholesale Global Listed Infrastructure Securities Fund as of March 31, 2014. All data in local currency terms.
Fund is not available for investment by US persons.
Any fund or stock mentioned in this presentation does not constitute any offer or inducement to enter into any investment activity
Source: First State Investments
9.3x
15.3x
2.0x
14
Vinci
Snapshot
Concessions: 4,000+ km motorways in France
Contracting: world leader in construction, road
building, energies
Research
Meetings with management (13) and competitors
(16) in Paris by 5 different analysts
Motorway comparison with Sanef, APRR;
analysis of toll structure and potential for
enhancement works
Value ranking
DCF value €57 implies 7.3x EBITDA
Market under-estimating resilience of traffic and
contracting margins
Vinci valuation ladder
70
60
Quality ranking
Vinci peak 8.5x
50
40
30
Contracting 2.0x
Portfolio construction
20
Best Idea: holding has ranged from 5-7%
10
Concession
compco 9.6x
Dec-13
Dec-12
Dec-11
Dec-10
Dec-09
Dec-08
Dec-07
0
Dec-05
Catalysts of traffic recovery, robust contracting
margins and bolt-on acquisitions
Contracting
compco 7.0x
Dec-06
156 (vs focus list 146) reflects asset quality
+motorways/-contracting, strong management
alignment, high free cash flow
Source: C FSGAM, Bloomberg
Sources: Company, Bloomberg, First State Investments
15
PPL Corp
Snapshot
Electric and Gas utility based in Pennsylvannia
Acquired distribution networks from E.ON in
Kentucky and Midlands (UK), transforming the
PPL business from 25% to 85% regulated
Research
Meetings with management (21) by six different
analysts, UK regulator (13), PA regulator (2),
supply competitors (91)
Value ranking
DCF value $37 implies 10.8x EBITDA
Market is discounting the company for competitive
generation business
Quality ranking
150 (vs focus list 146) reflects asset quality,
limited regulatory risk and industry consolidation
with the sale of the supply business.
Portfolio construction
Buy: holding ranged from 3-5%
Higher than average rate base growth of 7%
Catalysts of sale of supply business making this
company fully regulated
Sources: Company, Bloomberg, First State Investments
16
SSE PLC
Snapshot
UK Electric and Gas utility serving 9.5m
customers in the UK with a diversified generation
portfolio.
Research
Meetings with management (25) by three different
analysts, UK regulator (13), DECC (4), supply
competitors (89), Energy Retail Association,
Energy UK, Ferrybridge asset tour
Value ranking
DCF value £18 implies 10x EBITDA
Political turmoil has created mis-pricing
opportunities
Quality ranking
Dividend CAGR of 8.85%
between 1999 and 2013
154 (vs focus list 146) reflects asset quality,
strong executive management team and
operational performance
Portfolio construction
Buy: holding ranged from 3-6%
Catalysts include a tightening power market and
reduced regulatory and political risk
Sources: Company, Bloomberg, First State Investments
17
Aeroports de Paris
Snapshot
Unique asset – ADP operates Parisian airports
Charles de Gaulle and Orly. Diverse income
streams from aeronautical activity, airport retail
and real estate leasing
Research
Meetings with management (15), customers (3)
and other European airport operators (52) by 5
different analysts
Value ranking
DCF value €95 implies 9.7x EBITDA
Stock has performed strongly and now trades at
close to our target price
Quality ranking
134 (vs focus list 146) reflects ample runway and
terminal capacity, and robust free cash flow
generation; offset by significant government
influence, poor management alignment and an
unfocussed international strategy
Portfolio construction
Holding previously ranged from 1%-3% of the
portfolio
No longer held: we sold out in late 2013 as
improving traffic numbers led to out-performance
Sources: Company, Bloomberg, First State Investments
18
Investment process
Investment focus
We value infrastructure companies with the following characteristics:
Barriers to entry – monopoly assets providing essential services
Structural growth – organic growth less dependent on the economic cycle
Pricing power – inflation protection with recovery of uncontrollable costs
Financial strength – balance sheet flexibility and capital discipline
Management quality – sound strategy, execution, positive alignment
Sustainable culture – responsible approach to all stakeholders
Source: iStockphoto
20
Screening
•
Initial universe of ~200 securities is screened to produce Focus List of ~120 stocks
•
All available benchmarks have their limitations
Screen out:
•
High commodity exposures
•
Poor governance / alignment
•
Complex corporate structures
•
Non infrastructure companies
(e.g. logistics, shipping)
21
Fundamental research
•
Over 2,800 research visits to company management, asset tours, regulators,
industry associations, government agencies, customers and suppliers
•
Proprietary financial database of around 120 companies – detailed valuation
and quality comparisons
•
Analysts write in-depth ratings on companies
•
Shared meetings and research with FSI investment, economics and
sustainability teams
•
Government and industry studies (e.g. JD Power customer surveys)
22
Disclaimer
This presentation is confidential. No part of it may be reproduced or transmitted in any form or by any means without the prior written consent of First State
Investments (NZ) Limited (First State). This material contains or is based upon information that we believe to be accurate and reliable. While every effort has
been made to ensure its accuracy, First State does not warrant that it contains no factual errors. We would like to be told of any such errors in order to correct
them.
This material has been prepared for general information only by First State and Colonial First State Asset Management (Australia) Limited (CFS AMA). You
should not rely on the contents. To the fullest extent allowed by law, First State excludes all liability (whether arising in contract, from negligence or otherwise) in
respect of all and each part of the material, including without limitation, any errors or omissions. Past performance should not be taken as an indication of future
performance.
This material is intended only to provide a summary of the subject matter covered. It does not purport to be comprehensive or to render specific advice. It is not
an offer document, and does not constitute a recommendation of any securities. No person should act on the basis of any matter contained in this material
without obtaining specific professional advice. Product Disclosure Statements (PDS) and Information Memoranda (IM) for the funds issued by Colonial First
State Investments Limited ABN 98 002 348 352 (CFS) are available from First State. Investors should consider the relevant PDS or IM before making an
investment decision.
First State and CFS AMA are wholly owned subsidiaries of Commonwealth Bank of Australia (Bank). The Bank and its subsidiaries do not guarantee the
performance of any funds invested by clients of First State or the repayment of capital. Investments are not deposits or other liabilities of the Bank, its
subsidiaries or any other party and are subject to investment risk including loss of income and capital invested.
First State is part of Colonial First State Global Asset Management, the consolidated asset management division of the Commonwealth Bank of Australia ABN
48 123 123 124.
Copyright © First State Investments (NZ) Limited 2014
All rights reserved
23


