Final Presentation ()
advertisement
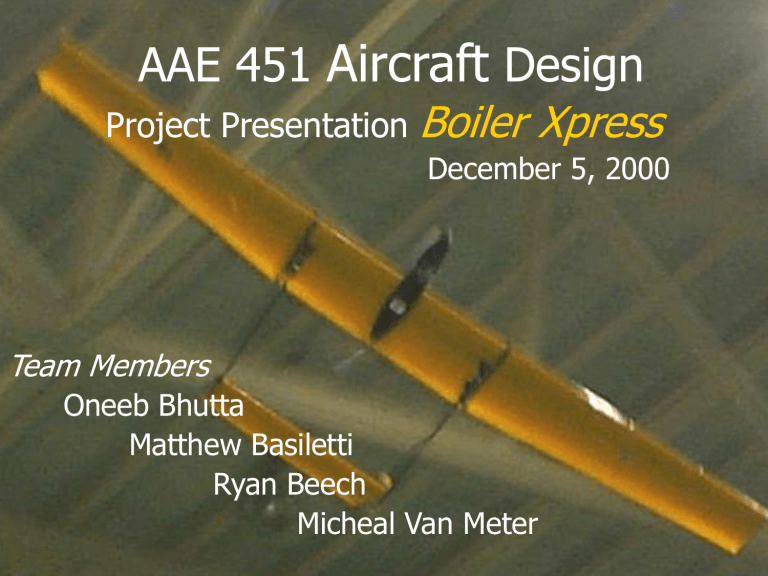
AAE 451 Aircraft Design Project Presentation Boiler Xpress December 5, 2000 Team Members Oneeb Bhutta Matthew Basiletti Ryan Beech Micheal Van Meter Presentation Overview Design Mission Concept Selection & Initial Sizing Detailed Analysis: Aerodynamics Structures Propulsion Stability, Dynamics, and Control Conclusions The Mission Variable Stability Aircraft- Roll Axis Flight Within Mollenkopf Athletic Ctr: 1.2 lb payload 20 ft/s stall speed 12 minute Endurance/ electric power plant Robust and Affordable Transportable Airframe cost < $200 Flight Mission 42’ Ceiling height 10 second “Straight Line” 35 ft Radius 120 ft. max T.O. roll 5.5 deg Climb Angle Weighted Objectives Method Score % of Total Rank 30 10.0 7 Build within 3 weeks 10.0 9.16 4 Light weight 27.5 16.66 1 Turning radius 9.16 16.66 2 50 10 6 Transportability 16.66 4 9 Ease of analysis 50 7.5 8 Landing ability 16.66 2.66 10 Maintainability 30 10 5 Marketability 10 13.33 3 Objective Endurance Robustness 1 4 2 3 5 Constraint Diagram Initial Sizing Electric Models wing area vs weight 1800 wing area (sq.in.) 1600 1400 1200 1000 800 600 400 200 0 0 50 100 150 200 Weight (oz) 250 300 350 400 Geometry and Configuration Boiler Xpress 11.1’ Wing: •Sref = 13.5 sq.ft. •Span = 11 ft. •Aspect Ratio = 9 •Taper Ratio = 0.6 tip section •Airfoil: S1220 Horizontal Stabilizer: •Area = 1.83 sq ft. •Span = 3.0 ft. Vertical Stabilizer: •Total Area: 1.15 sq.ft. 5.8’ Aerodynamic Design Issues Lift • Low Reynolds Number Regime • Slow Flight Requirements Drag • Power Requirements • Accurate Performance Predications Stability and Control • Trimmability • Roll Rate Derivatives Low Reynolds Number Challenges Separation Bubble-to be avoided! •Laminar Flow -more Prone to Separation •Airfoil Sections designed for Full-sized Aircraft don’t work well for below Rn=800,000 •Our Aircraft Rn=100,000-250,000 Airfoil Selection Wing: Selig S1210 CLmax = 1.53 Incidence= 3 deg Re = 150e3 0.06 0.05 flat plate for Low Re Incidence = -5 deg 0.04 Cd Tail sections: FX63137 S1210 0.03 S1223 0.02 0.01 0 -0.2 0 0.2 0.4 0.6 0.8 1 Cl 1.2 1.4 1.6 1.8 2 2.2 Drag Prediction Assume Parabolic Drag Polar CD CD0 KCL 1 K Ae e 0.75 2 Based on Empirical Fit of Existing Aircraft Parasite Drag Drag Build-up Method of Raymer C Do C f QFFS wet S ref (Ref. Raymer eq.12.27 & eq.12.30) Blasius’ Turbulent Flat Plate0.455 C f 1.2 2.58 Adjusted for Assumed log 10 (Re) Surface Roughness Drag Polar Aircraft Drag Polar 0.16 CD CDi CDo 0.14 0.12 0.1 0.08 0.06 0.04 0.02 0 0.2 0.4 0.6 0.8 1 CL 1.2 1.4 1.6 1.8 Power Required 32 Predict: • Battery energy for cruise 28 Power Required [ft-lb/s] • Power required for cruise 30 26 24 22 20 18 16 15 20 25 30 Velocity [ft/s] 35 40 Aerodynamic Properties Wetted area = 44.5 sq.ft. Span Efficiency Factor = 0.75 CLa = 5.3 / rad CL de = 0.4749 /rad L/Dmax = 15.5 Vloiter = 24 ft/s CLmax = 1.53 CLcruise = 1.05 Xcg = 0.10-0.38 (% MAC) Static Margin = 0.12 at Xcg = 0.35 Stability Diagram 0.3 elev deflect=-8 deg -4 0 4 8 0.2 Cmcg 0.1 elev deflect=-8 deg -4 0 0 4 8 -0.1 -0.2 -0.3 -0.4 0 0.2 0.4 0.6 0.8 1 CL 1.2 1.4 1.6 1.8 Flow Simulation Parasite Drag CDo for Wing and Tail surfaces t 4 FFW ing 1 0.6 c 100 t 1.34M 0.18 c x c For Fuselage, booms & pods FFPOD 0.35 1 f 60 f FFFuselage 1 3 100 f 400 (Ref. Raymer eq.12.31 & eq.12.33) l f d Structures Outline Materials Employed for the structure Mathematical Model Bending Moment & Stresses; Wing Test Equipment layout Landing Gears & Landing Loads Structural Materials Balsa spars carry bending load 0.25 in x 0.25 in T.E. Reinforcement Styrene foam wing core Materials Employed Wing Mathematical Model Wing Assumptions: •Wing and Weight loading •Method of Analysis (Theoretical Model) •2.5g x 1.5 Horizontal Tail Boom P Bending Moments Max Moment = 41.71 lbf/ft Stresses in Wing max M max y I Sigmamax = 2003 psi Sigmacritical = 1725 psi (Actual Test Result; Whiskey Tango Team, Spring 1999) Reasons: Light Weight Structure Safety Factor (worst case scenario) Wing Test Results P 1.5ft Horizontal Tail & Boom Horizontal Tail: Max Stress = 850psi Spar Sizes = 1/8 in x 1/16in Booms: Max deflection = 0.24 in @ 2.5g’s x 1.5 Assuming Young Modulus (E) for a Carbon Epoxy matrix. Testing needed to verify result. Material & Time Constraint Equipment Layout & CG. CG. = 30%~38% MAC (Predicted) CG. = 35% MAC (Actual) Landing Gear Rotation angle = 10 deg Tip Back angle= 14 deg Nose Gear: (3’’ from nose) Main gears: -6’’ from leading Edge -Separation (1.5 ft) From Raymer. Method of Sizing and placement of Landing gears Landing Loads 2 Ke 12 Wg Vvert 7.6in lb Vvert=2.2ft/s d Work kSds 0.5k 0 Vland=1.3Vstall=25ft/s For d = 1 in., k = 15.2 lb/in For 1 inch strut travel, peak load = 15.2 lb spar = 240 psi on landing g = -5 deg Propulsion Design Issues Power Special needs Endurance Propulsion system tests Power 55 50 Power Required Power Available 45 Power Required [ft-lb/s] Power required is determined by aircraft Power available comes from the motor 40 35 30 25 20 15 15 20 25 30 35 Velocity [ft/s] 40 45 50 Special Needs Pusher configuration Adjustable timing motor Reversible motor Propeller High efficiency for endurance Special propeller for electric flight System Components Propeller Freudenthaler 16x15 and 14x8 folding Gearbox “MonsterBox” (6:1,7:1,9.6:1) Motor Turbo 10 GT (10 cells) Speed Controller MX-50 System Efficiencies Propeller 60-65% Gearbox 95% Motor 90% Speed Controller 95% Total System Efficiency 50.7% Propulsion Tests Boiler Xpress Propulsion system Tests 1.8 1.6 1.4 1.2 Static Thrust (lb) 1 Test1 Test2 0.8 Test3 Test4 0.6 Endurance 0.4 0.2 0 -0.2 0:00:00 0:02:53 0:05:46 0:08:38 Tim e (h:m m :ss) 0:11:31 0:14:24 0:17:17 Motor/Prop Torque Sensor Test Stand Attached to Wind Tunnel Balance To Batteries Aircraft Analysis Best Endurance Speed Ve = 23.2 ft/s Power Required at Best Endurance Speed Pr = 15.62 ft-lb/s Flight Performance Increased weight 17% increase Increased cruise flight speed 22% increase Lift coefficient 26% decrease Endurance/Power 42% decrease in endurance Flight Performance, Stability & Control Sizing of horizontal and vertical tails and control surfaces Location of c.g. and aerodynamic center Determination of static margin Roll-axis block diagram Transfer functions Flight Performance Data Horizontal and Vertical Tail Initial Sizing Sh Vh S ref c xh (8.3) Sv Vv Sref b (8.4) xv Vh - Horizontal tail volume coefficient = 0.50 Vv - Vertical tail volume coefficient = 0.044 Control Surface Sizing Based on historical data from Roskam Part II Tables 8.1 and 8.2. Sa S ref Homebuilts 0.095 Single Engine 0.08 S a 1.35 ft 2 Sr Sv 0.42 0.36 S r 0.80 ft 2 Se Sh 0.44 0.42 S e 1.00 ft 2 Dihedral Angle Paper by William McCombs suggests 0 – 2 degrees for RC aircraft with ailerons. Estimated by Raymer for a mid-wing aircraft to be 2 – 4 degrees. Our Aircraft- 2 degrees X-plot Horizontal Tail -Used to find elevator area for desired Static Margin 0.8 SM X ac X cg 0.6 0.4 x/c Xac = 0.46 Xcg = 0.35 SM = 11% MAC cg location neutral point 1 0.2 0 -0.2 -0.4 1.2 1.4 1.6 1.8 2 2.2 2.4 2.6 Horizontal tail area [sq ft] 2.8 X-plot Vertical Tail 0.6 Cnb = 0.11 CnBeta Used to determine Weathercock stability (yaw) 0.4 0.2 0 -0.2 -0.4 0.4 0.6 0.8 1 1.2 1.4 Vertical tail area [sq ft] 1.6 1.8 Flight Performance Calculated Measured Take-off Distance (ft) 56.7 70 (astroturf) Turn Radius (ft) 50 < 40 Cruise Speed (ft/s) 24 28 Endurance (sec) 720 730 Block Diagram – Roll Axis Tx Servo Rx + da 1 Aircraft / Gyro k 950 s 40s 950 2 62.31 s 76.85 P Dynamic Modeling Ld a Lp qSbCld a I xx qSb 2Cl p 2 I xxU1 rad s 2 rad s P( s) 62.31 d a ( s ) s 76.85 C ld a = 0.80 C l p = -0.15 Root Locus De-stabilizing feedback 80 60 Imag Axis 40 20 0 -20 -40 -60 -80 -90 -80 -70 -60 -50 -40 -30 -20 Real Axis -10 0 10 20 Nyquist Diagram Nyquist Diagrams From: U(1) 0.3 K = 0.3655 Gm=25.4284 0.1 To: Y(1) Imaginary Axis 0.2 0 Pm=inf. -0.1 -0.2 -0.3 -0.4 -1 -0.8 -0.6 -0.4 -0.2 Real Axis 0 0.2 0.4 Economics Man-hours per week Structural Cost Break-Up Propulsion & Electronic Equipment Cost Total Cost of the project Man-Hours BoilerXpress Man hours per Week Total Team Hours 200 150 100 50 0 1 2 3 4 5 6 7 8 9 Number of Weeks 10 11 12 13 14 Structural Cost Cost = $292.00 others 11% Glue 23% wires 9% Balsa 7% Carbon fiber booms 22% fiber glass 3% foam 12% Micafilm 13% Structural Cost Break-Up Structural Cost Comp. CST CST CST Tower Tower Tower Tower Tower Tower Tower Tower Lowes Cat. # A105-A A206-A S-G01040-38 LXAS81 LXB243 LXB247 LXD867 LXD882 LXJC94 LXNK03 LXNK04 Description 105 resin Slow Hardener (5:1) Fiberglass 0.5 oz/sq-yd. (2 yards) 5510 Lite Ply 1/8"x6"x12" (6) yellow Micafilm 65" (rolls) yellow Micafilm 15' (rolls) Dubro Threaded Rod 2-56x12" (6) Dubro Nylon Kwik-Link Standard (2) 1/4"x3"x36" Balsa - 8pcs Motor Wire (black) Motor Wire (red) Blue or Pink Foam (4'x8' sheets) epoxy glue Carbon fiber 1/2" x .032" x 60 " tubes for booms screws and fasteners Purdue University Stickers spray paint Qty. 1 2 1 1 1 1 1 3 1 2 2 2 1 2 1 2 1 Price/unit $23.70 $11.40 $10.00 $12.59 $9.99 $26.99 $2.39 $0.70 $7.99 $6.49 $6.49 $17.00 $20.00 $32.75 $15.00 $4.99 $3.00 Total subtotal $23.70 $22.80 $10.00 $12.59 $9.99 $26.99 $2.39 $2.10 $7.99 $12.98 $12.98 $34.00 $20.00 $65.50 $15.00 $9.98 $3.00 $291.99 Motor & Electronic Equipment Propulsion & Electronic Equipment Cost Comp. Hobby Hobby Hobby Hobby Hobby MEC Cat. # HLAN241 HLAN3168 HLAN3186 HLAN4223 HLAN5145 Description Qty. 1/4" Prop Shaft Adapter 14x8 Prop Blade 16x15 Prop Blade 47mm Middlepart Yoke 45mm Spinner Motor Power Package 1 1 1 1 1 1 Price/unit subtotal $1.00 $13.40 $15.30 $12.00 $5.00 $200.00 Propulsion Tower LXTX41 Radio Control System (transmitter, receiver etc.) 1 Battery packs 1 Battery charger 1 Hitec/RCD HS-55J Economy Sub Micro Servo Futaba2 Rate Gyroscope 1 $1.00 $13.40 $15.30 $12.00 $5.00 $200.00 $246.70 $250.00 $70.00 $100.00 $19.99 $109.00 Electrical Equipment $250.00 $70.00 $100.00 $39.98 $109.00 $568.98 Total $815.68 Total Cost Build 55% Preliminary Design 41% Man-Hour Breakup Rate = $75/hour Testing 4% Preliminary Design Testing Build Test Material Structural Cost Prop and Elec Cost hours 525 50 720 Total Cost Cost $39,375.00 $3,750.00 $54,000.00 $81.70 $291.99 $815.68 $98,314.37 Conclusions Flight performance requirements met Turn radius Endurance Take-off distance Stabilizing feedback implemented Future Work Data logger installation Implement destabilizing feedback Refine propulsion analysis method (further testing) Perfect construction method Questions?
