03_worksheet
advertisement
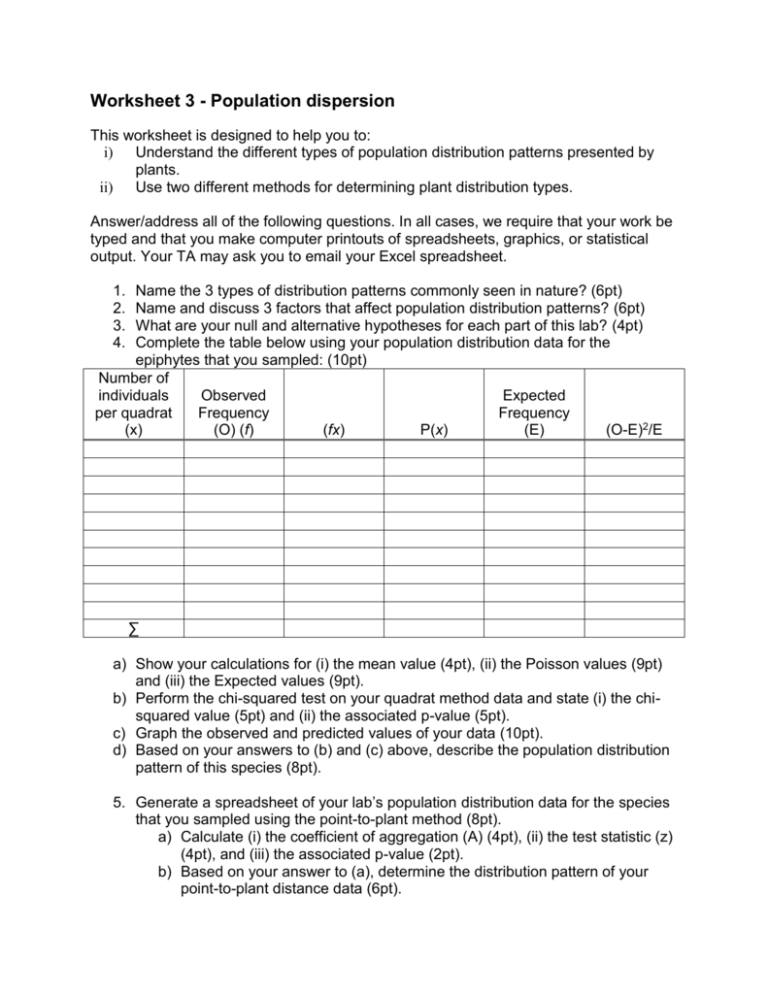
Worksheet 3 - Population dispersion This worksheet is designed to help you to: i) Understand the different types of population distribution patterns presented by plants. ii) Use two different methods for determining plant distribution types. Answer/address all of the following questions. In all cases, we require that your work be typed and that you make computer printouts of spreadsheets, graphics, or statistical output. Your TA may ask you to email your Excel spreadsheet. 1. 2. 3. 4. Name the 3 types of distribution patterns commonly seen in nature? (6pt) Name and discuss 3 factors that affect population distribution patterns? (6pt) What are your null and alternative hypotheses for each part of this lab? (4pt) Complete the table below using your population distribution data for the epiphytes that you sampled: (10pt) Number of individuals Observed Expected per quadrat Frequency Frequency (O) (f) (fx) P(x) (x) (E) (O-E)2/E ∑ a) Show your calculations for (i) the mean value (4pt), (ii) the Poisson values (9pt) and (iii) the Expected values (9pt). b) Perform the chi-squared test on your quadrat method data and state (i) the chisquared value (5pt) and (ii) the associated p-value (5pt). c) Graph the observed and predicted values of your data (10pt). d) Based on your answers to (b) and (c) above, describe the population distribution pattern of this species (8pt). 5. Generate a spreadsheet of your lab’s population distribution data for the species that you sampled using the point-to-plant method (8pt). a) Calculate (i) the coefficient of aggregation (A) (4pt), (ii) the test statistic (z) (4pt), and (iii) the associated p-value (2pt). b) Based on your answer to (a), determine the distribution pattern of your point-to-plant distance data (6pt).

