Project Rubric - Fairfield University
advertisement
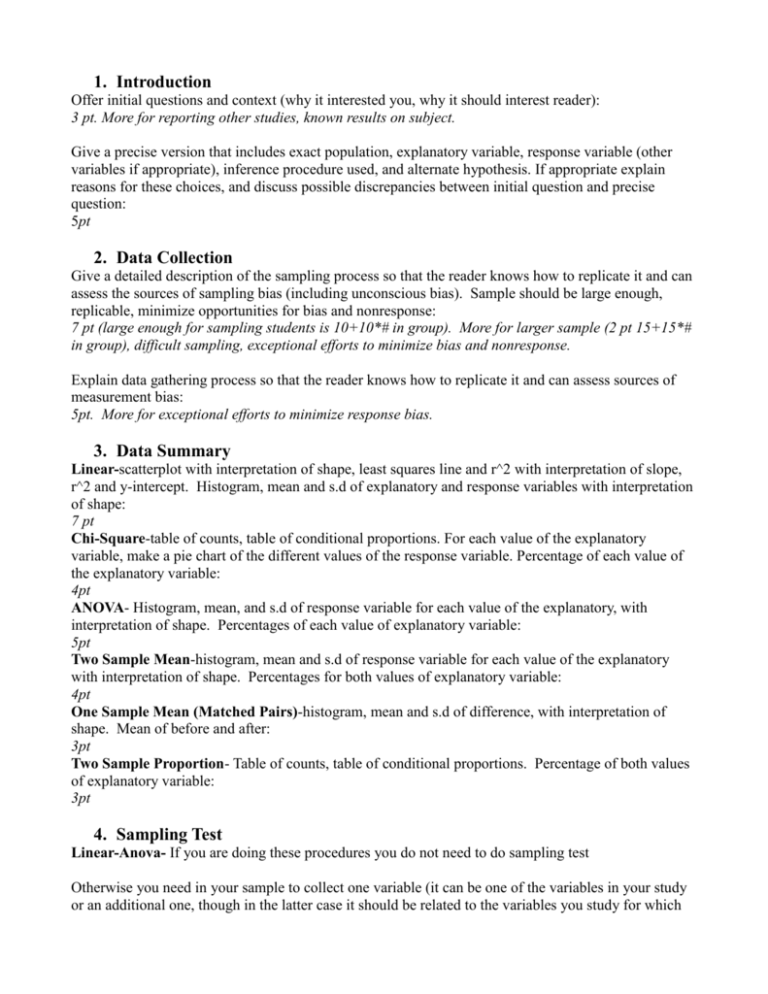
1. Introduction Offer initial questions and context (why it interested you, why it should interest reader): 3 pt. More for reporting other studies, known results on subject. Give a precise version that includes exact population, explanatory variable, response variable (other variables if appropriate), inference procedure used, and alternate hypothesis. If appropriate explain reasons for these choices, and discuss possible discrepancies between initial question and precise question: 5pt 2. Data Collection Give a detailed description of the sampling process so that the reader knows how to replicate it and can assess the sources of sampling bias (including unconscious bias). Sample should be large enough, replicable, minimize opportunities for bias and nonresponse: 7 pt (large enough for sampling students is 10+10*# in group). More for larger sample (2 pt 15+15*# in group), difficult sampling, exceptional efforts to minimize bias and nonresponse. Explain data gathering process so that the reader knows how to replicate it and can assess sources of measurement bias: 5pt. More for exceptional efforts to minimize response bias. 3. Data Summary Linear-scatterplot with interpretation of shape, least squares line and r^2 with interpretation of slope, r^2 and y-intercept. Histogram, mean and s.d of explanatory and response variables with interpretation of shape: 7 pt Chi-Square-table of counts, table of conditional proportions. For each value of the explanatory variable, make a pie chart of the different values of the response variable. Percentage of each value of the explanatory variable: 4pt ANOVA- Histogram, mean, and s.d of response variable for each value of the explanatory, with interpretation of shape. Percentages of each value of explanatory variable: 5pt Two Sample Mean-histogram, mean and s.d of response variable for each value of the explanatory with interpretation of shape. Percentages for both values of explanatory variable: 4pt One Sample Mean (Matched Pairs)-histogram, mean and s.d of difference, with interpretation of shape. Mean of before and after: 3pt Two Sample Proportion- Table of counts, table of conditional proportions. Percentage of both values of explanatory variable: 3pt 4. Sampling Test Linear-Anova- If you are doing these procedures you do not need to do sampling test Otherwise you need in your sample to collect one variable (it can be one of the variables in your study or an additional one, though in the latter case it should be related to the variables you study for which you know the mean or proportion in the population you are studying. For example if your population is Fairfield University students you might ask gender, whether they are in the College or not, their GPA, but you will need to get from a reputable source what the percentage of men or College students is in the University, or what the average GPA is at the University. Then you will use your data to test at the 5% significance level for evidence that the population proportion is different from the reputable figure. For example if the proportion of women at Fairfield is 60% and your sample has 32% women, you will get significant evidence that the population proportion is not 60%, which would be evidence that you are not sampling randomly from all Fairfield University students. If you get significant evidence in this test you should discuss in the sampling flaws section why you think your sampling method produced this particular bias. This is worth 4pt for two sample mean and Chi Squared and 5pt for two sample proportion. 5. Inferential Statistics Each claim tested should give alternate hypothesis, p-value, appropriate test statistic, and conclusion in terms of the specific variables and populations at the 5% significance level. Each confidence interval should be at the 95% confidence level and be expressed in a standard sentence giving parameter, variables and populations. Linear-test claim about slope, confidence interval for slope: 9pt Chi-Square- Test claim of dependence: 8pt ANOVA- Test claim of dependence: 8pt Two Sample Mean-Test claim about difference. Confidence interval for difference of means: 9pt One Sample Mean (Matched Pairs)-Test claim about difference. Confidence interval for mean of difference: 9pt Two Sample Proportion- Test claim about difference. Confidence interval for difference of proportions: 9pt 6. Assumptions Check each assumption, with explicit calculations or descriptive statistics as appropriate to explain why each assumption is or is not met: 7pt 7. Flaws/Biases Careful discussion of potential sources of sampling bias. Each should identify a group of individuals in population more or less likely to be chosen by sampling method, and a direction in which you would expect the response variable to differ for these individuals. Should include all reasonably obvious biases, and if there are none explain why there are not in this case: 6pt. More for a clever and particularly subtle bias. Careful discussion of potential sources of measurement bias, Each should identify a direction in which you would expect the value recorded for one variable to differ from the actual value of that variable for a typical individual. Should include all reasonably obvious biases, and if there are none explain why there are not in this case: 6pt. More for a clever and particularly subtle bias. Careful discussion of potential lurking variables. Each should identify a variable which affects the explanatory variable and is related to the response variable beyond its connection through the response variable. Should include all reasonably obvious lurking variables, and if there are none explain why there are not in this case: 6pt. More for a clever and particularly subtle bias. 8. Ways to Improve Study Discuss any ways you would do this study differently with the benefit of hindsight. Also offer possible ways (perhaps impractical) to address any failures to meet the assumptions and biases or lurking variables. If appropriate this may include how one could do an experiment to address the causal connection: 4pt 9. Conclusion/Interpretation If you found significant evidence, describe what is reasonable to conclude from this study. If you did not find significant evidence, explain why you might not have. Discuss which biases, lurking variables and failures of assumptions you think may have interfered with the conclusions: 4pt 10.Other Sources of Points Quality of exposition, including spelling and grammar, clarity, engaging writing and presentation of information: 8pt Clarity and accuracy of presentation to class: 6pt Completeness of presentation to class (should cover all the descriptive and inferential statistics in sections 3 and 4, and briefer version of the other 6 sections: 6pt Overall quality of presentation to class, including visuals, oral presentation, engaging and enjoyable: 6pt Groups submitted on time: 1pt Project plans submitted/completed on time: 2pt Using a technique covered less than a week before your presentation to class: 2pt Additional points as appropriate for creative and difficult project, using techniques not covered in class, or other efforts to go beyond the minimal requirements.
