Marginal-Costing-Theory
advertisement

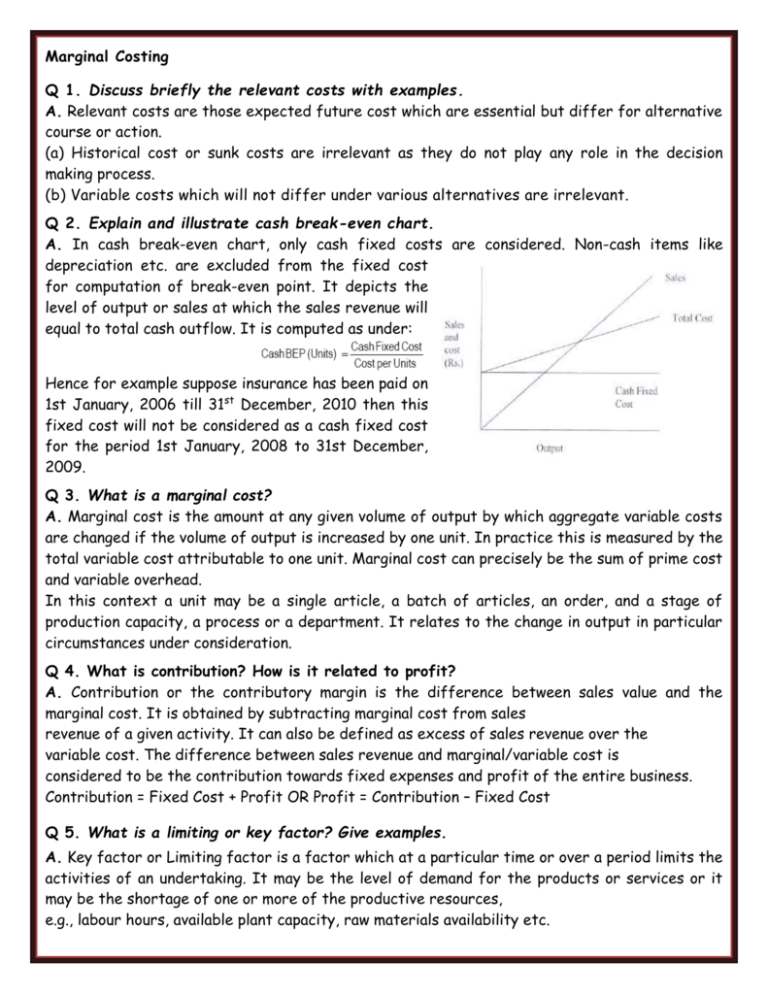
Marginal Costing Q 1. Discuss briefly the relevant costs with examples. A. Relevant costs are those expected future cost which are essential but differ for alternative course or action. (a) Historical cost or sunk costs are irrelevant as they do not play any role in the decision making process. (b) Variable costs which will not differ under various alternatives are irrelevant. Q 2. Explain and illustrate cash break-even chart. A. In cash break-even chart, only cash fixed costs are considered. Non-cash items like depreciation etc. are excluded from the fixed cost for computation of break-even point. It depicts the level of output or sales at which the sales revenue will equal to total cash outflow. It is computed as under: Hence for example suppose insurance has been paid on 1st January, 2006 till 31st December, 2010 then this fixed cost will not be considered as a cash fixed cost for the period 1st January, 2008 to 31st December, 2009. Q 3. What is a marginal cost? A. Marginal cost is the amount at any given volume of output by which aggregate variable costs are changed if the volume of output is increased by one unit. In practice this is measured by the total variable cost attributable to one unit. Marginal cost can precisely be the sum of prime cost and variable overhead. In this context a unit may be a single article, a batch of articles, an order, and a stage of production capacity, a process or a department. It relates to the change in output in particular circumstances under consideration. Q 4. What is contribution? How is it related to profit? A. Contribution or the contributory margin is the difference between sales value and the marginal cost. It is obtained by subtracting marginal cost from sales revenue of a given activity. It can also be defined as excess of sales revenue over the variable cost. The difference between sales revenue and marginal/variable cost is considered to be the contribution towards fixed expenses and profit of the entire business. Contribution = Fixed Cost + Profit OR Profit = Contribution – Fixed Cost Q 5. What is a limiting or key factor? Give examples. A. Key factor or Limiting factor is a factor which at a particular time or over a period limits the activities of an undertaking. It may be the level of demand for the products or services or it may be the shortage of one or more of the productive resources, e.g., labour hours, available plant capacity, raw materials availability etc. Q 6. Why is it important to classify costs as fixed and variable? A. Segregation of all expenses into fixed and variable elements is the essence of marginal costing. The primary objective of the classification of expenses into fixed and variable elements is to find out the marginal cost for various types of managerial decisions. The other uses of it are as below: (i) Control of expenses : The classification of expenses helps in controlling expenses. Fixed expenses are said to be sunk costs as these are incurred irrespective of the level of production activity and they are regarded as uncontrollable expenses. Since variable expenses vary with the production they are said to be controllable. (ii) Preparation of budget estimates: This distinction between fixed and variable cost also helps the management to estimate precisely the budgeted expenses. Q 7. What is a marginal cost equation? A. The contribution theory explains the relationship between the variable cost and selling price. It tells us that selling price minus variable cost of the units sold is the contribution towards fixed expenses and profit. If the contribution is equal to fixed expenses, there will be no profit or loss and if it is less than fixed expenses, loss is incurred. Since the variable cost varies in direct proportion to output, therefore if the firm does not produce any unit, the loss will be there to the extent of fixed expenses. These points can be described with the help of following marginal cost equation: (S × U) – (V × U) = F + P Where, S = Selling price per unit V = Variable cost per unit U = Units F = Fixed expenses P = Profit Q 8. Differentiate between absorption costing and marginal costing. Marginal costing 1. Only variable costs are considered for product costing and inventory valuation. 2. Fixed costs are regarded as period costs. The Profitability of different products is judged by their P/V ratio. 3. Cost data presented highlight the total contribution of each product. 4. The difference in the magnitude of opening stock and closing stock does not affect the unit cost of production. Absorption costing Both fixed and variable costs are considered for product costing and inventory valuation. Fixed costs are charged to the cost of production. Each product bears a reasonable share of fixed cost and thus the profitability of a product is influenced by the apportionment of fixed costs. Cost data are presented in conventional pattern. Net profit of each product is determined after subtracting fixed cost along with their variable costs. The difference in the magnitude of opening stock and closing stock affects the unit cost of production due to the impact of related fixed cost. Q 9. What are the advantages and disadvantages of marginal costing? A. Advantages of Marginal Costing 1. The marginal cost remains constant per unit of output whereas the fixed cost remains constant in total. Since marginal cost per unit is constant from period to period within a short span of time, firm decisions on pricing policy can be taken. 2. If fixed overheads are included on the basis of pre-determined rates, there will be either under-recovery or over-recovery of overheads. Marginal costing avoids such under or over recovery of overheads. 3. The stock of finished goods and work-in-progress are carried on marginal cost basis and the fixed expenses are written off to profit and loss account as period cost. This shows the true profit of the period. 4. Marginal costing helps in the preparation of break-even analysis which shows the effect of increasing or decreasing production activity on the profitability of the company. 5. Segregation of expenses as fixed and variable helps the management to exercise control over expenditure. 6. Marginal costing helps the management in taking a number of business decisions like make or buy, discontinuance of a particular product, replacement of machines, etc. Limitations of Marginal Costing 1. It is difficult to classify exactly the expenses into fixed and variable category. Some expenses are neither totally variable nor wholly fixed. 2. Contribution of a product itself is not a guide for optimum profitability unless it is linked with the key factor. 3. Sales staff may mistake marginal cost for total cost and sell at a price; which will result in loss or low profits. Hence, sales staff should be cautioned while giving marginal cost. 4. Overheads of fixed nature cannot altogether be excluded particularly in large contracts, while valuing the work-in- progress. In order to show the correct position fixed overheads have to be included in work-in-progress. 5. Some of the assumptions regarding the behaviour of various costs are not necessarily true in a realistic situation. For example, the assumption that fixed cost will remain static throughout is not correct. Fixed cost may change from one period to another. For example salaries bill may go up because of annual increments or due to change in pay rate etc. The variable costs do not remain constant per unit of output. There may be changes in the prices of raw materials, wage rates etc. after a certain level of output has been reached due to shortage of material, shortage of skilled labour, concessions of bulk purchases etc. 6. Marginal costing ignores time factor and investment. For example, the marginal cost of two jobs may be the same but the time taken for their completion and the cost of machines used may differ. The true cost of a job which takes longer time and uses costlier machine would be higher. This fact is not disclosed by marginal costing. Q 10. Critically discuss the assumptions underlying CVP analysis. A. Cost volume profit (CVP) analysis is the analysis of three variables cost, volume and profit. Such an analysis explores the relationship between costs, revenue, activity levels and the resulting profit. It aims at measuring variations in cost and volume. CVP analysis is based on the following assumptions: 1. Changes in the levels of revenues and costs arise only because of changes in the number of units produced and sold. 2. Total costs can be separated into two components; a fixed component that does not vary with output level and a variable component that changes with respect to output level. 3. When represented graphically, the behaviour of total revenues and total costs are linear in relation to output level within a relevant range and time period. 4. Selling price, variable cost per unit, and total fixed costs within a relevant range and time period are known and constant. 5. The analysis either covers a single product or assumes that the proportion of different products when multiple products are sold will remain constant as the level of total units sold changes. 6. All revenues and costs can be added, subtracted, and compared without taking into account the time value of money. Q 11. Explain: (i) Breakeven Chart (ii) Contribution Breakeven Chart (iii) Profit-volume Chart A. (i) Breakeven Chart: A breakeven chart records costs and revenues on the vertical axis and the level of activity on the horizontal axis. The breakeven point is that point where the sales revenue line intersects the total cost line. Other measures like the margin of safety and profit can also be measured from the chart. (ii) Contribution Breakeven Chart: It is not possible to use a breakeven chart to measure contribution. This is one of its major limitations especially so because contribution analysis is literally the backbone of marginal costing. To overcome such a limitation contribution breakeven chart is used, which is based on the same principles as a conventional breakeven chart except for that it shows the variable cost line instead of the fixed cost line. Lines for Total cost and Sales revenue remain the same. The breakeven point and profit can be read off in the same way as with a conventional chart. However it is also possible to read the contribution for any level of activity. The contribution can be read as the difference between the sales revenue line and the variable cost line. (iii) Profit-volume Chart: This is also very similar to a breakeven chart. In this chart the vertical axis represents profits and losses and the horizontal axis is drawn at zero profit or loss. In this chart each level of activity is taken into account and profits marked accordingly. The breakeven point is where this line interacts the horizontal axis. The loss at a nil activity level is equal to Rs. 2,00,000, i.e. the amount of fixed costs. The second point used to draw the line could be the calculated breakeven point or the calculated profit for sales of a particular number of units. Advantages of the profit-volume chart: The biggest advantage of the profit-volume chart is its capability of depicting clearly the effect on profit and breakeven point of any changes in the variables. Q 12. Distinguish between Marginal Costing and Differential Costing. A. Marginal Costing is defined as the ‘Ascertainment of marginal costs and of the effect on profit of changes in volume or type of output by differentiating between fixed costs and variable costs’. Differential Costing is defined as the technique of costing which uses differential costs and/or differential revenues for ascertaining the acceptability of an alternative. The technique may be termed as incremental costing when the difference is increase in costs and decremental costing when the difference is decrease in costs. The main points of distinction between marginal costing and differential costing are as below: (a) The technique of marginal costing requires a clear distinction between variable costs and fixed costs whereas no such distinction is made in the case of differential costing. (b) In marginal costing, margin of contribution and contribution ratio are the main yard sticks for performance evaluation and for decision making whereas under differential costs analysis, differential costs are compared with the incremental or decremental revenue (as the case may be) for arriving at a decision. (c) Differential cost analysis is possible in both absorption costing and marginal costing, where as marginal costing in itself is a distinct technique. (d) Marginal cost may be incorporated in the cost accounting system whereas differential costs are worked out separately.


