Scientific Method
advertisement

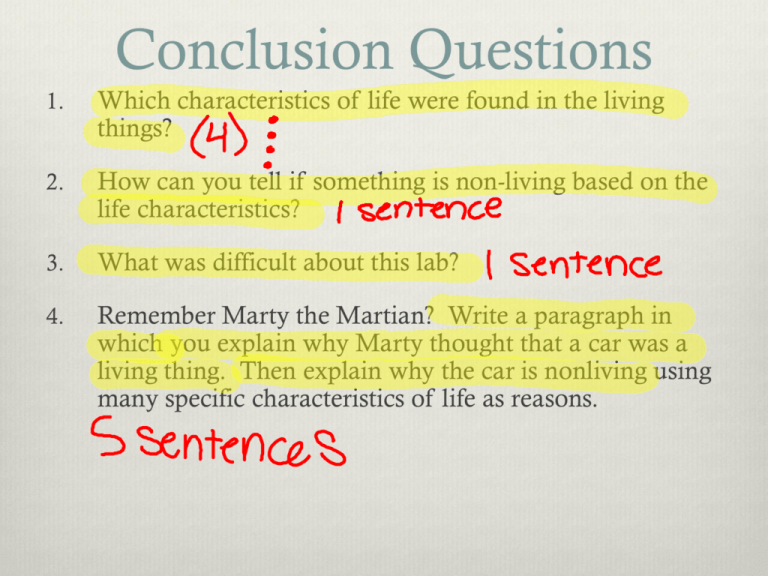
Conclusion Questions 1. Which characteristics of life were found in the living things? 2. How can you tell if something is non-living based on the life characteristics? 3. What was difficult about this lab? 4. Remember Marty the Martian? Write a paragraph in which you explain why Marty thought that a car was a living thing. Then explain why the car is nonliving using many specific characteristics of life as reasons. BELLRINGER 8.27.2013 1. Give an example of a COMPLETE SENTENCE. BellRinger 9.5.2013 1. Describe what an apple looks like. 2. Observe the following picture and describe it. 3. Observe the following picture and describe it. BellRinger 9.5.2013 ZOMBIE APOCALYPSE! 1. How could you design an experiment to test the best way to avoid zombies? BellRinger 9.6.2013 1. III. The Scientific Method Scientific Method: steps that scientists use to gather information and answer questions. 1. Question/Observation/Problem: noticing something that nobody has noticed before 2. “People trip a lot at Central.” Hypothesis: an explanation for a question or an educated guess. “If students walk on our wood floors, then they will stumble more often than on other surfaces.” 3. Experiment: an investigation that tests a hypothesis by collecting information under controlled conditions “Today, I will count how many people stumble on the wood floors each passing period.” a. Control: the group in which all conditions are kept the same “Tomorrow, I will count again at the same time, but in the basement where the floors are concrete.” b. Independent variable: condition that is changed The surface that students are walking on (the cause). c. Dependent variable: condition that changes due to the independent variable. Whether or not people trip (the effect). d. Data: information collected from the experiment Scientific Method Cont. 4. Conclusion: reporting of experimental data 5. Theory: a hypothesis supported by a large body of evidence “I did the experiment every day for a month and the results were always similar. I believe the wood floors here make us TRIP.” BellRinger 9.6.2013 Me’Shell predicted that vitamin water would help zombies get stronger. She kept two zombies; one got regular water and one got vitamin water. 1. What is the control? Zombie w/regular water 2. What is the Independent variable? Vitamin water 3. What is the dependent variable? Zombie strength Bellringer 8/25/10 1. List the steps of the scientific method in order. 2. Describe the difference between an independent variable and a dependent variable. Writing a Lab Report 1. Title: What is the experiment about 2. Purpose: WHY is the experiment being performed? 3. Hypothesis: predict the outcome; educated guess. 4. Materials: what was used in the experiment 5. Procedure: “Recipe Style” directions of how to perform the experiment. Writing a lab report (CONT.) 6. Organize Data: report quantitative and qualitative data 7. Conclusion: brief summary of the data and an explanation of whether the data supports the hypothesis. Bellringer 8/27/10 1. In the heart rate experiment what data did you collect? Heart rate or bmp 2. In the toothpick tower experiment what data did you collect? Height of the tower 3. Why is data collection important when performing an experiment Helps to form a conclusion and show evidence IV. Types of Information 1. Quantitative Data: numerical or measurable data, usually expressed in graphs or tables SI Units: universal-measuring units used to report quantitative data a. Meters= length b. Gram= mass or weight c. Liter= volume d. Second= time e. Celsius degree= temperature 2. Qualitative Data: written descriptions of what scientist observe Graphing review 1. Where is the X-axis? 2. Where is the Y-axis? 3. What is a line graph? 4. What is a bar graph? Bellringer 8/31/09 1. What is quantitative data? Numerical data ex. 20 cm 2. What is qualitative data? Descriptive words ex. Purple, soft 3. Why are SI units used in collecting scientific data SI units are universally understood around the world V.Rules of Graphing Scientific Data 1. Title the graph: Tree species VS height 2. Label the axis: • X-axis is the horizontal axis • Contains information related to the independent variable, example tree species Y-axis is the vertical axis Always contains numbers , example tree height Tree Species VS Height Height Tree Species Rules of Graphing Scientific Data (CONT). 3. Number the axis: first look at the data table and round the largest number to the nearest 10th place 50 m 4. Count the number of boxes on the graph paper for that axis 10 boxes Data Table Trees Elm Maple Cherry Box Elder height 48 m 35 m 6m 4m Tree Species VS Height 50 45 40 35 Height 30 25 20 15 10 5 0 Elm Maple Cherry Tree Species Box Elder Tree Species VS Height 50 45 40 35 Height 30 25 20 15 10 5 0 Elm Maple Cherry Tree Species Box Elder M & M Graphs 1. Color 2. Create a data chart like the following # of plain # of peanut Total Create a single bar graph that expresses the # of plain M & M’s of each color. Use colored pencils to express each, label axis, and title the graph. Bellringer 9/1/09 1. When is graphing useful in science? For organizing and interpreting numerical data 2. Sketch a graph and label the following a. X-axis b. Y-axis Y-axis X-axis 3. Why is it important to label the x and y axis correctly? So you know what the graphing showing M&M graphing 1. Create a double bar graph depicting plain and total M&M’s by color. 2. Create a single line graph depicting peanut M&M’s by color. 3. Create a double line graph depicting peanut and plain M&M’s by color. Don’t forget to label axis’s, title, include a key (double’s only). Bellringer 9/1/09 1. What would be a good title for this graph? 2. Which class has the most students? 3. Which class has the least students? Interpreting graphs a) What length of worm is most common? _____________ b) What was the longest worm found? _____________ Interpreting graphs c) How many worms were 6 cm long? ____________ d) How many worms were 7.25 cm long? ____________ e) The peak of the curve represents the [ longest worms / average worms ] Assignment Choose two data tables and graph them. Label axis Title the graph Then write three sentences to interpret the data shown. Look for trends Look for specific information 9/3/09 1. What are the steps of the scientific method? 2. What are the steps for writing a lab report? Bellringer 9/4/09 1. What is an Isopod? 2. What does an Isopod eat? 3. Where does an Isopod live? 4. Describe the Isopods impact on the Ecosystem? Bellringer 9/8/09 1. Numerical or measurable data is an example of ____________data . a. Quantitative b. Qualitative 2. The information collected from experiments is called ________. a. 3. the conclusion b. The data A hypothesis supported by a large body of evidence refers to a(n) ______ a. Experiment b. Theory Bellringer 9/9/09 1. Define Biology. 2. The steps commonly used by scientists to gather information and test a hypothesis is the ________ a. Research 3. b. scientific method Experiments that produce written description contain _________ data. a. qualitative b. quantitative 4. What are SI units? What to study for the test Highlighted words in your notebooks Characteristics of Life Scientific Method Experimenting terms (control, independent) Data terms (quantitative, qualitative, SI units) How to write a lab report Graphing Look over Bellringer questions 9/11/08 1. How do pill bugs breathe? a. Lungsb. Gills 2. c. Trachea In a lab report the ______ answers the question, Why is the experiment being preformed a. Purpose/problem b. conclusion 3. What was the independent variable in your pill bug lab yesterday? Writing a Lab Report 1. Title: what is the experiment about 2. Purpose: Answers the question, WHY is the experiment being performed 3. Hypothesis: predict the outcome; educated guess 4. Materials: what things were used in the experiment 5. Procedure: “Recipe Style” directions of how to perform the experiment


