6 week GCSE revision plan
advertisement
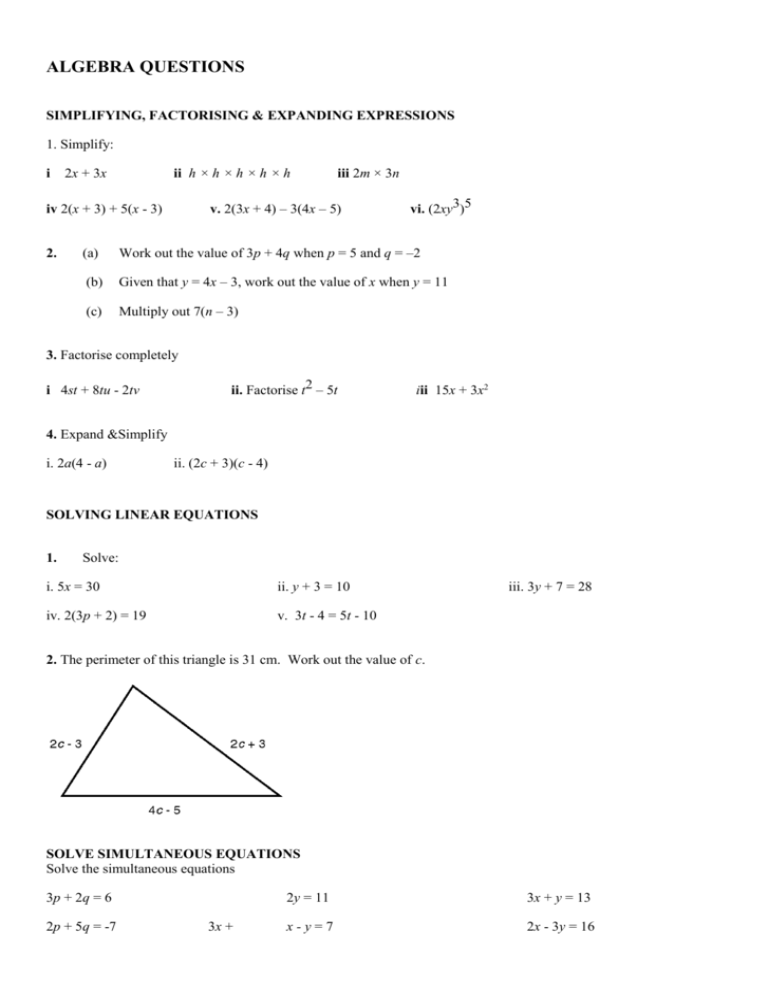
ALGEBRA QUESTIONS SIMPLIFYING, FACTORISING & EXPANDING EXPRESSIONS 1. Simplify: i 2x + 3x ii h × h × h × h × h v. 2(3x + 4) – 3(4x – 5) iv 2(x + 3) + 5(x - 3) 2. iii 2m × 3n vi. (2xy3)5 (a) Work out the value of 3p + 4q when p = 5 and q = –2 (b) Given that y = 4x – 3, work out the value of x when y = 11 (c) Multiply out 7(n – 3) 3. Factorise completely i 4st + 8tu - 2tv ii. Factorise t2 – 5t iii 15x + 3x2 4. Expand &Simplify i. 2a(4 - a) ii. (2c + 3)(c - 4) SOLVING LINEAR EQUATIONS 1. Solve: i. 5x = 30 ii. y + 3 = 10 iv. 2(3p + 2) = 19 v. 3t - 4 = 5t - 10 iii. 3y + 7 = 28 2. The perimeter of this triangle is 31 cm. Work out the value of c. SOLVE SIMULTANEOUS EQUATIONS Solve the simultaneous equations 3p + 2q = 6 2p + 5q = -7 3x + 2y = 11 3x + y = 13 x-y=7 2x - 3y = 16 TRIAL & IMPROVEMENT 1. Use a trial and improvement method to solve the equation x3 - x = 15 Complete the working below and find a solution correct to one decimal place. x x=2 x=3 2. x3 - x 23 - 2 = 6 33 - 3 = 24 Too small Too big Use the method of trial and improvement to find the positive solution of x3 + x = 37 Give your answer correct to 1 decimal place. FACTORISING QUADRATICS 1. Factorise & Solve i. x2 + 7x + 12 ii. x2 + 7x + 12 = 0iii. x2 + 7x – 60 iv. x2 - 4x - 21 INEQUALITIES 1. x is an integer, such that -3 < x 2. List all the possible values of x. 2. x is an integer. Write down the greatest value of x for which 2x < 7 On the number line below show the solution to these inequalities. -7 2x - 3 < 3 3. Solve the inequality 7y > 2y – 3 STRAIGHT LINE GRAPHS AND Y = MX + C 1. a Make a table of values for y = 2x + 3 b Draw the graph of y = 2x + 3 on the grid below. c Use your graph to find the value of y when x = -1 d. On the same axes draw the graph of x + y = 5 e. Use your graph to find the solution to the simultaneous equations: x + y = 5 and y = 2x + 3 REAL-LIFE GRAPHS Jane drove 320 km from her home to the airport. The travel graph shows Jane’s journey. 320 280 Distance from home in km 1. 240 200 160 120 80 40 1 3 2 4 5 Time in hours During the journey, Jane stopped for lunch. (a) (i) For how long did Jane stop for lunch? ………………………… (ii) How far had Jane travelled in the first 90 minutes? …………………….. km (2) (b) Work out the steady speed that Jane travelled at after lunch. ……………………. km/h (2) INDICES 1. (a) Simplify (i) (d) 2. (a) (a) x6 x2 (ii) x8 x3 (iii) (e) (y4)3 (f) (ii) 36 2 y4 y3 y5 5x3y4 × 7xy2 Evaluate (i) 10. p2 × p7 3–2 1 (i) Write as a power of 5 (i) 54 × 52 (ii) 59 ÷ 56 64 0 (ii) 1 64 2 NUMBER QUESTIONS PRIME FACTORS: HCF & LCM 1. Write as a product of their prime factors: i. 2. 12 ii. 60 iii. 96 Find the HCF of: i. 12 and 60 3. ii. 60 and 96 Find the LCM of 12 and 60 4. Express the following numbers as products of their prime factors. (i) 56 (ii) 84 5. Find the Highest Common Factor of 56 and 84. USING CALCULATORS 1. Use your calculator to work out the following; In each case, write down all the figures on your calculator: 6.2 3.92 1.25 560.3 20.3 (0.2 + 4.5)2 (23.4 35.6) 5.7 200.3 (16.2 815 . ) For each question above, write down your answers to 3 significant figues 2. PERCENTAGES 1. (a) Write 11% as a fraction. (b) Write 0.25 as a percentage. (c) Write 8% as a decimal. (d) Work out 40% of 200. (e) Work out £480 as a percentage of £600. (f ) Work out 45% of 800 3. Wayne bought an engagement ring for Tracy. The total cost of the ring was £420 plus VAT at 17 12 %. Work out the cost of the ring. 4. Wallace bought a computer for £3000. Each year the computer depreciated by 20%. Work out its value two years after he bought it. 5. Frances see three different advertisements for jeans. Work out the cost of the jeans in each advertisement. 6. The table gives information about an estate agent’s charges for selling a house. Value of the house Estate agent’s charges Up to £60 000 2% of the value of the house Over £60 000 2% of the first £60 000 plus 1% of the remaining value of the house Ken uses this estate agent to sell his house. The estate agent sold Ken’s house for £80 000. Work out the total charge that Ken will have to pay. £................................ FRACTIONS 1. Here are two fractions 3 2 and . Explain which is the larger fraction 5 3 2. Write these numbers in order of size. Start with the smallest number. 1 2 2 3 , , , 2 3 5 4 2 3 5 8 Work out 5 23 – 2 34 3. Work out 4. A school has 1200 pupils. 575 of these pupils are girls. 2 5 of the girls like sport. 3 5 of the boys like sport. Work out the total number of pupils in the school who like sport. 5. Lisa used 1 1 of her lottery win to buy a house. She gave of her lottery win to a charity. 2 6 Lisa then shared the remainder of her lottery win equally between her four children. Work out the fraction of Lisa’s lottery win that each of her four children received. RATIO & PROPORTION 1. Write 45 : 60 as a ratio in its simplest form. 2. Jack and Jill share £18 in the ratio 1:5 Work out how much each person gets. 3. Derek, Erica and Fred share £108 in the ratio 3:4:2. Calculate the amount of money Erica gets 4. In 2001, the club’s total income was £1000. The club spent 60% of its total income on a hall. It spent a further £250 on prizes. Work out the ratio The amount spent on the hall : the amount spent on prizes. 5. The length of a coach is 15 metres. Jonathan makes a model of the coach. He uses a scale of 1:24 Work out the length, in centimetres, of the model coach. 6. Cedric buys 12 pencils for £3.48. Work out the cost of 20 pencils. 7. It takes 6 men 8 days to build a wall. All the men work at the same rate. How long would it take 4 men to build a wall the same size? 8. Here is a recipe for making 10 chocolate chip cookies. Chocolate Chip Cookies Makes 10 cookies. 100 g of flour 60 g of sugar 50 g of margarine 40 g of chocolate chips 2 eggs Work out the amounts needed to make: i. 15 chocolate chip cookies. ii. 9 chocolate chip cookies. COMPOUND MEASURES 1. The mass of 5 m3 of copper is 44 800 kg. (a) Work out the density of copper. The density of zinc is 7130 kg/m3. (b) Work out the mass of 5 m3 of zinc 3. How long does it take a cyclist to travel 3.5km at 15m/s 4. Tom bought a necklace in the United States of America. Tom paid 108 dollars ($). Arthur bought an identical necklace in Germany. Arthur paid 117 Euros ( ) £1 = $1.44 £1 = 1.6 Calculate, in pounds, the difference between the prices paid for the two necklaces. SHAPE, SPACE & MEASURE QUESTIONS ANGLE PROPERTIES 1. Find angle y 45º 122º yº 2. Find angles x and y Diagram NOT accurately drawn x° A B 48° y° C 3. a. The diagram shows a quadrilateral Work out the size of the angle marked aº. b The diagram shows a regular hexagon. Work out the size of the angle marked bº. c The diagram shows a regular octagon. Work out the size of the angle marked cº. Diagram NOT accurately drawn (a) Work out the size of an exterior angle of a regular pentagon. AREAS OF SHAPES 1. The diagram shows a shape. Work out the area of the shape. 20 cm Diagram NOT accurately drawn 9 cm 4 cm 8 cm 2. 9.7 cm The radius of the circle is 9.7 cm. Work out the area of the circle. Give your answer to 3 significant figures. 3. The diagram shows a circle of diameter 70 cm inside a square of side 70 cm. Work out the area of the shaded part of the diagram. Give your answer correct to 3 significant figures. 4. The diameter of a circle is 12 centimetres. (a) Work out the circumference of the circle. Give your answer, in centimetres, correct to 1 decimal place. VOLUMES OF PRISMS 1. In this question you must write down the units of your answer. a Work out the area of the base of the solid shape. b i Work out the volume of the solid shape. ii Write this volume in litres 2. The shape below is the cross section of a prism 10 cm long. Calculate the volume of the prism. TRANSFORMATIONS 1. a Reflect shape S in the line x = 0. Label the new shape T. b Rotate the new shape T through an angle of 90º anticlockwise using (0, 0) as the centre of rotation. Label the new shape U. c Describe fully the single transformation that will move shape U back onto shape S. 2. Triangle A and triangle B have been drawn on the grid. (a) Reflect triangle A in the line x = 3. Label this image C. (b) Describe fully the single transformation which will map triangle A onto triangle B. BEARINGS, LOCI & CONTRSUCTIONS The diagram represents a triangular garden ABC. The scale of the diagram is 1 cm represents 1 m. A tree is to be planted in the garden so that it is nearer to AB than to AC, within 5 m of point A. On the diagram, shade the region where the tree may be planted. B A C PYTHAGORS THEOREM 1. 3.2 cm X Y Diagram NOT accurately drawn 1.7 cm Z Calculate the length of YZ. Give your answer correct to 3 significant figures. 2. A 7 cm B 7 cm M 8 cm C Work out the length, in centimetres, of AM. Give your answer correct to 2 decimal places. DATA HANDLING QUESTIONS MEAN, MEDIAN AND MODE 1. Five boxes are weighed. Their weights are given below. 3 kg, 11 kg, 5 kg, 20 kg, 11 kg, Write down the: Mean, Median, Mode and the Range of their weights ESTIMATE OF THE MEAN 1. Charles found out the length of reign of each of 41 kings.He used the information to complete the frequency table. Length of reign (L years) Number of kings 0 < L 10 14 10 < L 20 13 20 < L 30 8 30 < L 40 4 40 < L 50 2 x (a) Write down the class interval that contains the median. (b) Calculate an estimate for the mean length of reign. fx 2. A teacher asked 50 children how much pocket money they got each week. The table shows some information about their replies. Pocket money (£x) Frequency 0<x2 1 2<x4 10 4<x6 23 6<x8 14 8 < x 10 2 Work out the estimate for the mean amount of pocket money the children got. STEM & LEAF DIAGRAMS 1. Andy counted the number of letters in each of 30 sentences in a newspaper. Andy showed his results in a stem and leaf diagram. 0 8 8 9 1 1 2 3 4 4 8 9 2 0 3 5 5 7 7 8 3 2 2 3 3 6 6 8 8 4 1 2 3 3 5 Key 4 1 (a) (b) (c) stands for 41 letters Write down the number of sentences with 36 letters. Work out the range. Work out the median. 2. Mary recorded the heights, in centimetres, of the girls in her class. 132 167 144 170 150 172 152 177 160 181 162 182 Show her results in a stem and leaf diagram. 162 182 167 QUESTIONNAIRES 1. Mr Smith is going to sell drinks on his coaches. He wants to know what type of drinks people like. He designs a questionnaire. Design a suitable questionnaire, which he could use to find out what type of drink people like. 2. The manager of a school canteen has made some changes. She wants to find out what students think of these changes. She uses this question on a questionnaire. "What do you think of the changes in the canteen?" Excellent (a) Very good Write down what is wrong about this question. This is another question on the questionnaire. "How much money do you normally spend in the canteen?" A lot Not much (b) Write down one thing that is wrong with this question. (c) Design a better question for the canteen manager to use. You should include some response boxes. 3. Sanjay prepares a questionnaire. Here is one of his questions. What is your age in years? under 20 20 – 30 30 – 40 40 – 50 over 50 What is wrong with this question? Good TWO-WAY TABLES 1. Girls Boys Totals 50 pupils are going on an educational visit. The pupils have to choose to go to one of the theatre or the art gallery or the science museum. Theatre 11 19 Art gallery 9 Science museum Totals 13 20 23 50 a Complete the table. b How many of the girls choose to visit the science museum? CUMULATIVE FREQUENCY DIAGRAMS 1. The table shows information about the heights of 40 bushes. (a) Height (h cm) Frequency 170 h < 175 5 175 h < 180 18 180 h < 185 12 185 h < 190 4 190 h < 195 1 Complete the cumulative frequency table. Height (h cm) Cumulative Frequency 170 h < 175 170 h < 180 170 h < 185 170 h < 190 170 h < 195 (b) On the grid, draw a cumulative frequency graph for your table. 40 Cumulative frequency 30 20 10 0 170 175 180 185 (c) Use the graph to find an estimate for the median height of the bushes. 190 195 Height (h cm) BOX PLOTS An IT company has 80 employees. The age of the youngest employee is 24 years. The age of the oldest employee is 54 years. The median age is 38 years. The lower quartile age is 30 years. The upper quartile age is 44 years. On the grid, draw a box plot to show information about the ages of the employees. 0 10 20 30 40 Age (A) in years 50 60 2. The times, in seconds, taken by 11 teachers to solve a puzzle are listed in order 4 (a) (b) 12 13 17 18 20 22 24 25 30 10 15 20 25 30 35 Find (i) the lower quartile, (ii) the interquartile range. Draw a box plot for this data. 0 5 Time (seconds) 34 70 PROBABILITY 1. A fair coin is tossed and a fair dice is thrown. One possible outcome is (Heads, 4). List all the possible outcomes. 2. A fair dice is to be thrown. a Write down the probability of the dice landing on i a six ii an even number A second dice is to be thrown. The probability that this dice will land on each of the numbers 1 to 6 is given in the table. number probability 1 x 2 0.2 3 0.1 4 0.3 5 0.1 6 0.2 The dice is to be thrown once. b Calculate the value of x. c Calculate the probability that the dice will land on a number higher than 3. The dice is thrown 1000 times. d Estimate the number of times the dice is likely to land on a six. 3. 80 Year 12 students each study one Science. The table shows some information about these students. Biology Female Chemistry Physics 18 47 19 Male Total Total 21 33 (a) Complete the table. One of these students is picked at random. (b) Write down the probability that the student studies Physics. 80 4. The table shows information about the number of fillings the students in a class had last year. Number of fillings Number of students 0 10 1 5 2 4 3 2 More than 3 1 The headteacher is to choose a student at random from the class. Find the probability that she will choose a student who had 5. (a) exactly 1 filling, (b) 2 or more fillings, (c) either 1 filling or 2 fillings. 5 white socks and 3 black socks are in a drawer. Stefan takes out two socks at random. Work out the probability that Stefan takes out two socks of the same colour. TREE DIAGRAMS 1. Amy is going to play one game of snooker and one game of billiards. The probability that she will win the game of snooker is The probability that she will win the game of billiards is (a) (b) 3 4 1 3 Complete the probability tree diagram. Work out the probability that Amy will win exactly one game. 2. Julie and Pat are going to the cinema. The probability that Julie will arrive late is 0.2 The probability that Pat will arrive late is 0.6 The two events are independent. (a) Complete the diagram. Pat 0.6 Julie late late 0.2 not late late not late not late (b) Work out the probability that Julie and Pat will both arrive late.
