John Deere (DE)
advertisement
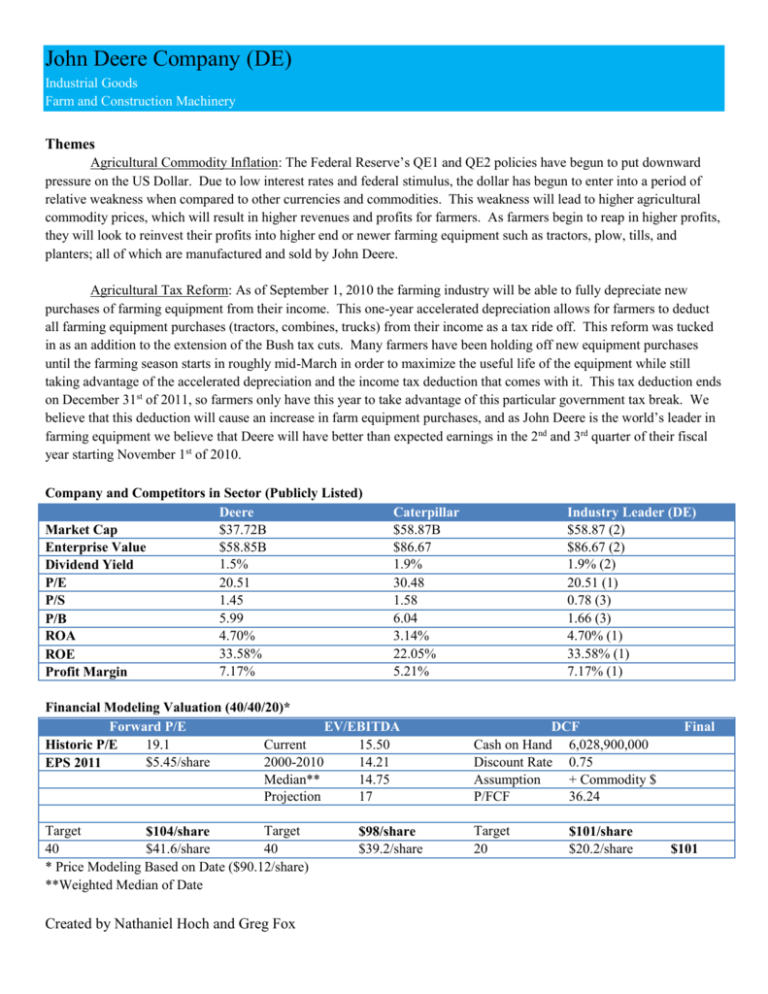
John Deere Company (DE) Industrial Goods Farm and Construction Machinery Themes Agricultural Commodity Inflation: The Federal Reserve’s QE1 and QE2 policies have begun to put downward pressure on the US Dollar. Due to low interest rates and federal stimulus, the dollar has begun to enter into a period of relative weakness when compared to other currencies and commodities. This weakness will lead to higher agricultural commodity prices, which will result in higher revenues and profits for farmers. As farmers begin to reap in higher profits, they will look to reinvest their profits into higher end or newer farming equipment such as tractors, plow, tills, and planters; all of which are manufactured and sold by John Deere. Agricultural Tax Reform: As of September 1, 2010 the farming industry will be able to fully depreciate new purchases of farming equipment from their income. This one-year accelerated depreciation allows for farmers to deduct all farming equipment purchases (tractors, combines, trucks) from their income as a tax ride off. This reform was tucked in as an addition to the extension of the Bush tax cuts. Many farmers have been holding off new equipment purchases until the farming season starts in roughly mid-March in order to maximize the useful life of the equipment while still taking advantage of the accelerated depreciation and the income tax deduction that comes with it. This tax deduction ends on December 31st of 2011, so farmers only have this year to take advantage of this particular government tax break. We believe that this deduction will cause an increase in farm equipment purchases, and as John Deere is the world’s leader in farming equipment we believe that Deere will have better than expected earnings in the 2nd and 3rd quarter of their fiscal year starting November 1st of 2010. Company and Competitors in Sector (Publicly Listed) Deere $37.72B Market Cap $58.85B Enterprise Value 1.5% Dividend Yield 20.51 P/E 1.45 P/S 5.99 P/B 4.70% ROA 33.58% ROE 7.17% Profit Margin Caterpillar $58.87B $86.67 1.9% 30.48 1.58 6.04 3.14% 22.05% 5.21% Financial Modeling Valuation (40/40/20)* Forward P/E EV/EBITDA 19.1 Current 15.50 Historic P/E $5.45/share 2000-2010 14.21 EPS 2011 Median** 14.75 Projection 17 Target Target $104/share 40 $41.6/share 40 * Price Modeling Based on Date ($90.12/share) **Weighted Median of Date Created by Nathaniel Hoch and Greg Fox $98/share $39.2/share Industry Leader (DE) $58.87 (2) $86.67 (2) 1.9% (2) 20.51 (1) 0.78 (3) 1.66 (3) 4.70% (1) 33.58% (1) 7.17% (1) DCF Cash on Hand 6,028,900,000 Discount Rate 0.75 Assumption + Commodity $ P/FCF 36.24 Target 20 $101/share $20.2/share Final $101
