Vehicle Stopping Distance Key
advertisement
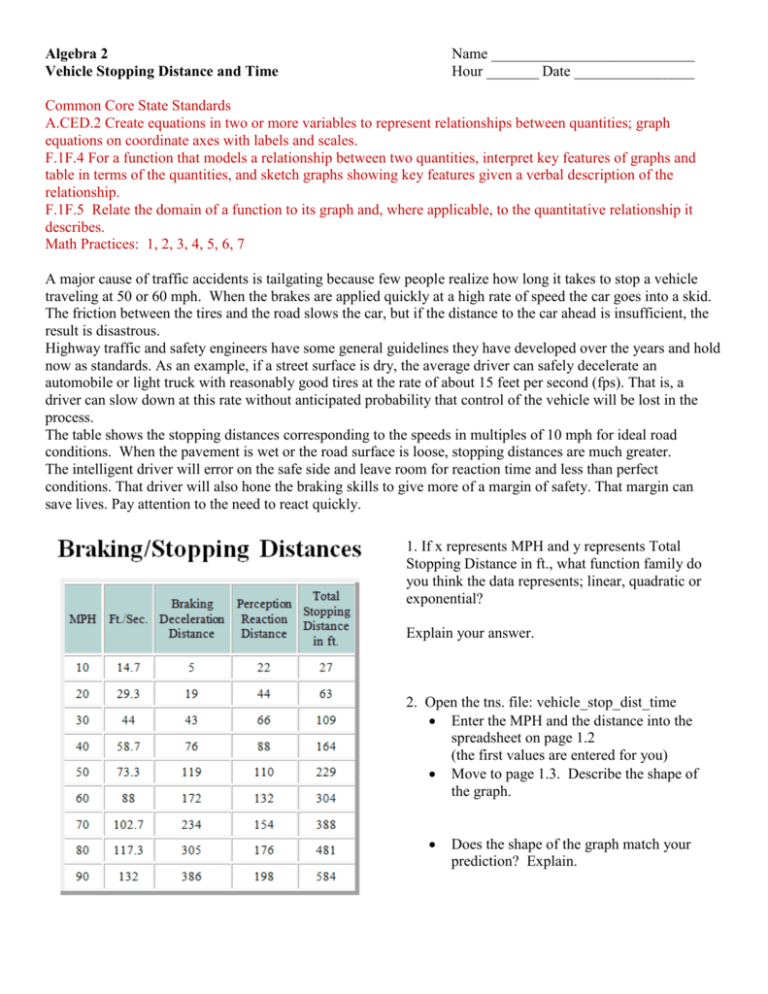
Algebra 2 Vehicle Stopping Distance and Time Name ___________________________ Hour _______ Date ________________ Common Core State Standards A.CED.2 Create equations in two or more variables to represent relationships between quantities; graph equations on coordinate axes with labels and scales. F.1F.4 For a function that models a relationship between two quantities, interpret key features of graphs and table in terms of the quantities, and sketch graphs showing key features given a verbal description of the relationship. F.1F.5 Relate the domain of a function to its graph and, where applicable, to the quantitative relationship it describes. Math Practices: 1, 2, 3, 4, 5, 6, 7 A major cause of traffic accidents is tailgating because few people realize how long it takes to stop a vehicle traveling at 50 or 60 mph. When the brakes are applied quickly at a high rate of speed the car goes into a skid. The friction between the tires and the road slows the car, but if the distance to the car ahead is insufficient, the result is disastrous. Highway traffic and safety engineers have some general guidelines they have developed over the years and hold now as standards. As an example, if a street surface is dry, the average driver can safely decelerate an automobile or light truck with reasonably good tires at the rate of about 15 feet per second (fps). That is, a driver can slow down at this rate without anticipated probability that control of the vehicle will be lost in the process. The table shows the stopping distances corresponding to the speeds in multiples of 10 mph for ideal road conditions. When the pavement is wet or the road surface is loose, stopping distances are much greater. The intelligent driver will error on the safe side and leave room for reaction time and less than perfect conditions. That driver will also hone the braking skills to give more of a margin of safety. That margin can save lives. Pay attention to the need to react quickly. 1. If x represents MPH and y represents Total Stopping Distance in ft., what function family do you think the data represents; linear, quadratic or exponential? Explain your answer. 2. Open the tns. file: vehicle_stop_dist_time Enter the MPH and the distance into the spreadsheet on page 1.2 (the first values are entered for you) Move to page 1.3. Describe the shape of the graph. Does the shape of the graph match your prediction? Explain. 3. Press Menu >Analyze >Regression and find the regression equation for the data.. 4. What is the y-intercept of the regression equation? About 0.05 ft What does it represent in terms of the problem? Stopping distance at 0 mph Based on the information given, what is the “Real World Domain” for the problem? 0 < x < 90 (speed limit is 70 mph on expressways in Michigan, 90 would be an extreme value) 5. If the speed limit in your neighborhood is 25 mph, what would be the stopping distance? Put x = 25 into equation. 84.8 ft Good opportunity to discuss rounding, why averaging 20 and 30 would give a different answer (not linear) If the average lot is 100 feet wide, how would that compare to the distance in front of your house? About how many car lengths would that be for a midsize car? If you use 14 feet for the average car, then about 6 car lengths. Discussion point. How to determine the average car length.
