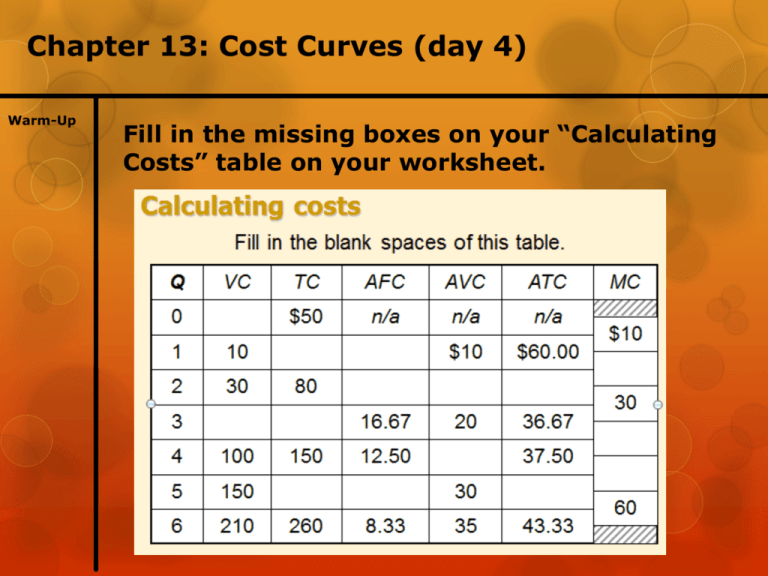
Chapter 13: Cost Curves (day 4)
Warm-Up
Fill in the missing boxes on your “Calculating
Costs” table on your worksheet.
ACTIVE LEARNING
Answers
3
Use
AFC
FC/Q
ATC
AVC
= TC/Q
VC/Q
MC
and
First,relationship
deduce
FC between
= $50 and
use
FCTC
+ VC = TC.
Q
VC
TC
AFC
AVC
ATC
0
$0
$50
n/a
n/a
n/a
1
10
60
$50.00
$10
$60.00
2
30
80
25.00
15
40.00
3
60
110
16.67
20
36.67
4
100
150
12.50
25
37.50
5
150
200
10.00
30
40.00
6
210
260
8.33
35
43.33
© 2012 Cengage Learning. All Rights Reserved. May not be copied, scanned, or duplicated, in whole or in part, except for use as
permitted in a license distributed with a certain product or service or otherwise on a password-protected website for classroom use.
MC
$10
20
30
40
50
60
EXAMPLE 2: Why ATC Is Usually U-Shaped
As Q rises:
$200
Initially,
falling AFC
pulls ATC down.
$175
Efficient scale:
The quantity that
minimizes ATC.
Costs
Eventually,
rising AVC
pulls ATC up.
$150
$125
$100
$75
$50
$25
$0
0
1
2
3
4
5
6
7
Q
© 2012 Cengage Learning. All Rights Reserved. May not be copied, scanned, or duplicated, in whole or in part, except for use as
permitted in a license distributed with a certain product or service or otherwise on a password-protected website for classroom use.
3
Costs in the Short Run & Long Run
Short run:
Some inputs are fixed (e.g., factories, land).
The costs of these inputs are FC.
Long run:
All inputs are variable
(e.g., firms can build more factories,
or sell existing ones).
In the long run, ATC at any Q is cost per unit
using the most efficient mix of inputs for that Q
(e.g., the factory size with the lowest ATC).
© 2012 Cengage Learning. All Rights Reserved. May not be copied, scanned, or duplicated, in whole or in part, except for use as
permitted in a license distributed with a certain product or service or otherwise on a password-protected website for classroom use.
4
EXAMPLE 3: LRATC with 3 factory sizes
Firm can choose
from three factory Avg
Total
sizes: S, M, L.
Cost
Each size has its
own SRATC curve.
The firm can
change to a
different factory
size in the long
run, but not in the
short run.
© 2012 Cengage Learning. All Rights Reserved. May not be copied, scanned, or duplicated, in whole or in part, except for use as
permitted in a license distributed with a certain product or service or otherwise on a password-protected website for classroom use.
ATCS
ATCM
ATCL
Q
5
EXAMPLE 3: LRATC with 3 factory sizes
To produce less
than QA, firm will
choose size S
in the long run.
To produce
between QA
and QB, firm will
choose size M
in the long run.
To produce more
than QB, firm will
choose size L
in the long run.
Avg
Total
Cost
ATCS
ATCM
ATCL
LRATC
QA
© 2012 Cengage Learning. All Rights Reserved. May not be copied, scanned, or duplicated, in whole or in part, except for use as
permitted in a license distributed with a certain product or service or otherwise on a password-protected website for classroom use.
QB
Q
6
A Typical LRATC Curve
In the real world,
factories come in
many sizes,
each with its own
SRATC curve.
ATC
LRATC
So a typical
LRATC curve
looks like this:
Q
© 2012 Cengage Learning. All Rights Reserved. May not be copied, scanned, or duplicated, in whole or in part, except for use as
permitted in a license distributed with a certain product or service or otherwise on a password-protected website for classroom use.
7
How ATC Changes as
the Scale of Production Changes
Economies of
scale: ATC falls
as Q increases.
ATC
LRATC
Constant returns
to scale: ATC
stays the same
as Q increases.
Diseconomies of
scale: ATC rises
as Q increases.
© 2012 Cengage Learning. All Rights Reserved. May not be copied, scanned, or duplicated, in whole or in part, except for use as
permitted in a license distributed with a certain product or service or otherwise on a password-protected website for classroom use.
Q
8
How ATC Changes as
the Scale of Production Changes
Economies of scale occur when increasing
production allows greater specialization:
workers more efficient when focusing on a
narrow task.
More common when Q is low.
Diseconomies of scale are due to coordination
problems in large organizations.
E.g., management becomes stretched, can’t
control costs.
More common when Q is high.
© 2012 Cengage Learning. All Rights Reserved. May not be copied, scanned, or duplicated, in whole or in part, except for use as
permitted in a license distributed with a certain product or service or otherwise on a password-protected website for classroom use.
9


