Chapter 2 - SharpSchool
advertisement
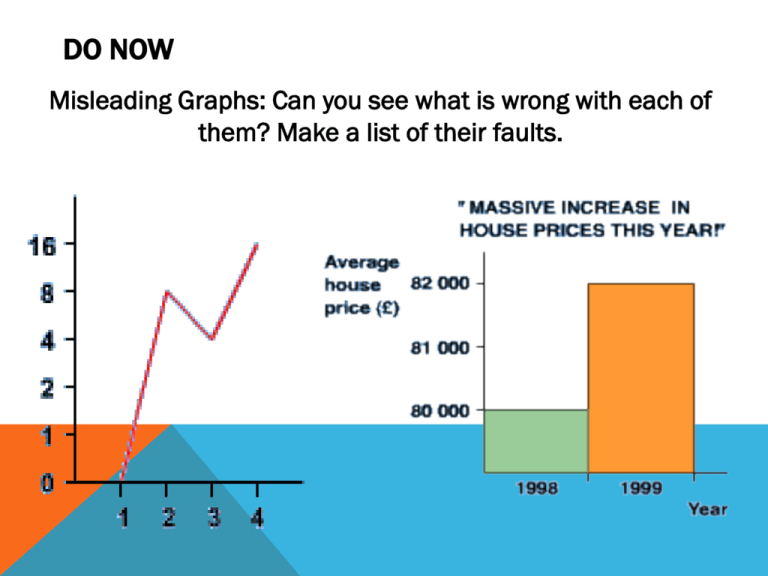
DO NOW Misleading Graphs: Can you see what is wrong with each of them? Make a list of their faults. DIRECT INSTRUCTION There is absolutely no talking while I am speaking Use the slides to fill out your graphic organizer. Write down notes and examples in the Cornell Notes Format Absolutely no talking during DI. After the first warning you will receive Tuesday Lunch Recentering CORNELL NOTES CHAPTER 2 STATS IN YOUR WORLD I N T RO D U C T I O N TO STAT I ST I C S WHAT IS STATISTICS? Statistics is the study of the collection, organization, analysis, interpretation, and presentation of data. It deals with all aspects of this, including the planning of data collection in terms of the design of surveys and experiments. DATA Values of qualitative or quantitative variables. All data is not numerical Data is useless without its proper context To understand the context of data, you must know the 5 W’s: Who, What, When, Where, Why. WHO Who - Who the data is about. Surveys: Respondents Experiment: Subjects or participants. We refer to the who as a case. What we call the case depends on the situation. The who is not always a person!!!!! Order Name Number Ship To Price Area Code Gift ASIN Artist 10542 9 Mia True Ohio 12.99 301 Y B00052K Beyonc 9 e 10642 1 Tom Day Florida 10.99 215 N B00042C 7 Adele For example, the who in this example are the CD purchases. Samples vs. Populations In statistics, we must note the difference between samples and populations. POPULATION "The term "population" is used in statistics to represent all possible measurements or outcomes that are of interest to us in a particular study." Sample • "The term "sample" refers to a portion of the population that is representative of the population from which it was selected." EXAMPLE In March 2007, Consumer reports published an evaluation of large screen, high definition television sets (HDTVs). The magazine purchased and tested 98 different models from a variety of manufacturers. Question: What are the population of interest? The sample? The who of this study? THE POPULATION IS LARGE SCREEN HD TV’s The sample are the 98 sets tested. The who of the study is the 98 hd tv’S. TRY THIS Turn to page 9 in the textbook. Answers numbers 1 – 3 of the Just Checking Section. (5mins) 1) All mini cars 2) 4255 recently purchased mini cars. 3) The mini cars purchased by the 4255 users. (The OWNERS are not the who because we are interested in making generalizations about the cars NOT WHO PURCHASED THEM) WHAT Variables – The characteristics recorded about each individual. There are two types of variables: 1. Quantitative 2. categorical VARIABLES QUANTITATIVE Variables measure either how much or how many of something. categorical variables name categories or answer questions about how cases fall. To really understand a variable, you must Think about what you want to know AND DO NOT . For example: are area codes quantitative or categorical? WHEN, WHERE, WHY SELF EXPLANATORY! CLASSWORK P.11 and 12 (#4 - 6) Answers: 4)To find out what buyers like about their cars (in order to improve future cars). 5) a) categorical b)quantitative c)quantitative d) quantitative e) categorical f)categorical 6) Who – tour de France, What – year, winner, country, time, speef, stages, etc, Where – France, When – 1903 – 2009, Why - ??? INDEPENDENT PRACTICE Page 17 #1 - 8

