Statistics AP/GT - University of Houston
advertisement
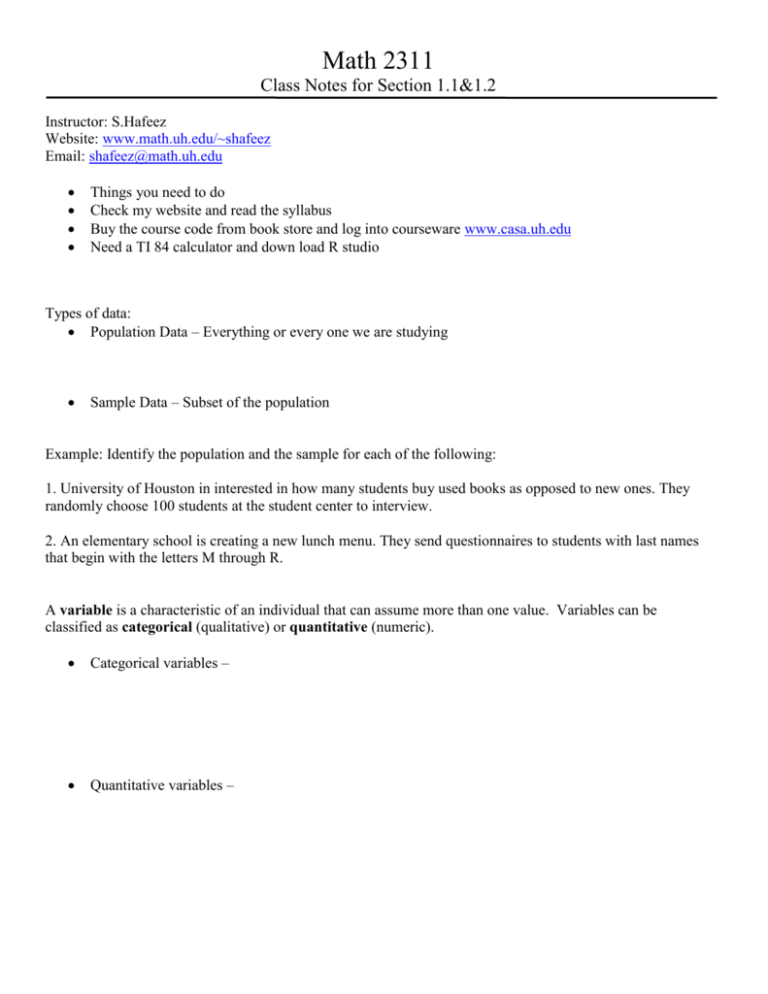
Math 2311 Class Notes for Section 1.1&1.2 Instructor: S.Hafeez Website: www.math.uh.edu/~shafeez Email: shafeez@math.uh.edu Things you need to do Check my website and read the syllabus Buy the course code from book store and log into courseware www.casa.uh.edu Need a TI 84 calculator and down load R studio Types of data: Population Data – Everything or every one we are studying Sample Data – Subset of the population Example: Identify the population and the sample for each of the following: 1. University of Houston in interested in how many students buy used books as opposed to new ones. They randomly choose 100 students at the student center to interview. 2. An elementary school is creating a new lunch menu. They send questionnaires to students with last names that begin with the letters M through R. A variable is a characteristic of an individual that can assume more than one value. Variables can be classified as categorical (qualitative) or quantitative (numeric). Categorical variables – Quantitative variables – Other type of Data Univariate: one variable. Bivariate: two variable Multivariate: many variables. Quantitative variables can be classified as either discrete or continuous. Discrete quantitative variables – Continuous quantitative variables – Example: Classify the following variables as categorical or quantitative. If quantitative, state whether the variable is discrete or continuous. 3. Political preference. 4. Number of siblings. 5. Blood type. 6. Height of women on a UH swimming team. 7. Time it takes to be on hold when calling the doctor office during week day’s office hours. Math 2311 Class Notes for Section 1.2 One question we want to answer about data is about its location, particularly the location of its center. Mean – Symbols for mean: µ and 𝑥̅ Median – Mode – Examples: 1. Twelve babies spoke for the first time at the following ages (in months): 8 9 10 11 12 13 15 15 18 20 20 26 a. What is the mean of the data? b. What is the median of the data? 2. Here are the weights (in pounds) of 20 steers on an experimental feed diet: 174,142,131,145,175,150,176,151,110,162,133,163,135,178,178,154,166,146,156,167 a. What is the mean of the data? 154.6 b. What is the median of the data? 155 c. What is the mode of the data? 178 3. The test scores of a class of 20 students have a mean of 71.6 and the test scores of another class of 14 students have a mean of 78.4. Find the mean of the combined group. 4. Explain why the conclusion drawn is not valid: A businesswoman calculates that the median cost of the five business trips that she took in a month is $600 and concludes that the total cost must have been $3000.
