QUESTION 8 : Models more in detail. S
advertisement
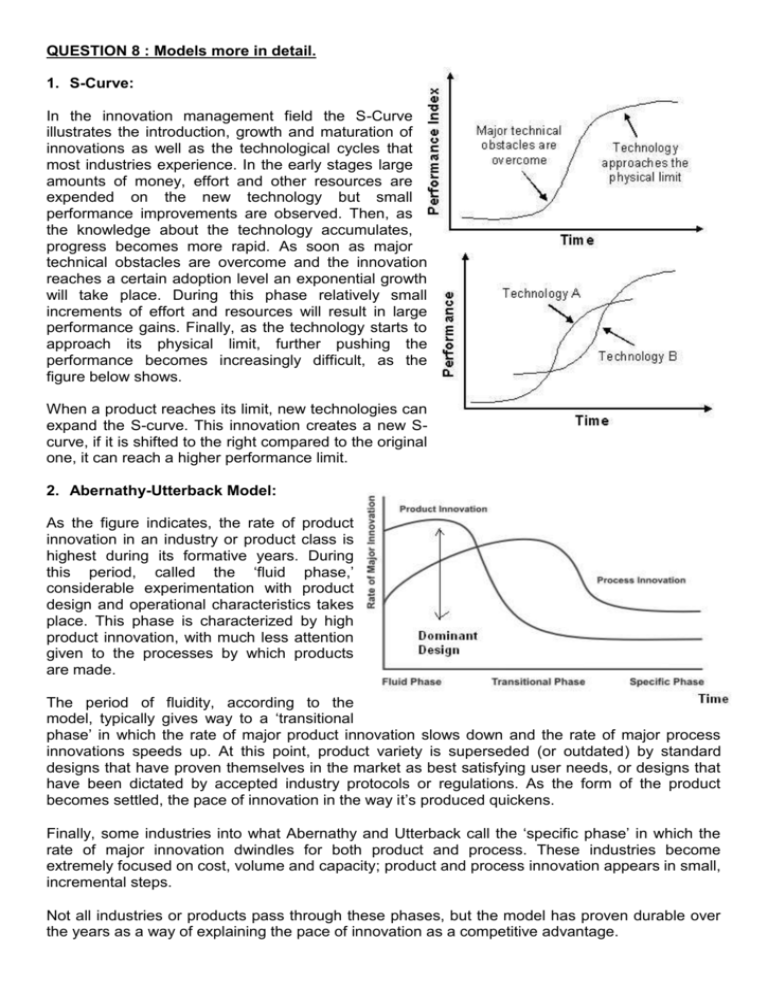
QUESTION 8 : Models more in detail. 1. S-Curve: In the innovation management field the S-Curve illustrates the introduction, growth and maturation of innovations as well as the technological cycles that most industries experience. In the early stages large amounts of money, effort and other resources are expended on the new technology but small performance improvements are observed. Then, as the knowledge about the technology accumulates, progress becomes more rapid. As soon as major technical obstacles are overcome and the innovation reaches a certain adoption level an exponential growth will take place. During this phase relatively small increments of effort and resources will result in large performance gains. Finally, as the technology starts to approach its physical limit, further pushing the performance becomes increasingly difficult, as the figure below shows. When a product reaches its limit, new technologies can expand the S-curve. This innovation creates a new Scurve, if it is shifted to the right compared to the original one, it can reach a higher performance limit. 2. Abernathy-Utterback Model: As the figure indicates, the rate of product innovation in an industry or product class is highest during its formative years. During this period, called the ‘fluid phase,’ considerable experimentation with product design and operational characteristics takes place. This phase is characterized by high product innovation, with much less attention given to the processes by which products are made. The period of fluidity, according to the model, typically gives way to a ‘transitional phase’ in which the rate of major product innovation slows down and the rate of major process innovations speeds up. At this point, product variety is superseded (or outdated) by standard designs that have proven themselves in the market as best satisfying user needs, or designs that have been dictated by accepted industry protocols or regulations. As the form of the product becomes settled, the pace of innovation in the way it’s produced quickens. Finally, some industries into what Abernathy and Utterback call the ‘specific phase’ in which the rate of major innovation dwindles for both product and process. These industries become extremely focused on cost, volume and capacity; product and process innovation appears in small, incremental steps. Not all industries or products pass through these phases, but the model has proven durable over the years as a way of explaining the pace of innovation as a competitive advantage. 3. Disruptive Innovation Model: Harvard Business School professor Clayton M. Christensen described his Disruptive Innovation Model in The Innovator’s Dilemma (1997). The model identifies three critical elements of disruption. First, in every market, there’s a rate of improvement that customers can utilize or absorb, represented by the dotted line slopping gently upward across the chart. To simplify the chart, customers’ ability to utilize improvement is depicted as a single line; in reality, there’s a distribution of customers around this median—a range indicated by the distribution curve at the right. Customers in the highest or most demanding tiers may never be satisfied with the best that’s available and those in the lowest or least demanding tiers can be over satisfied with very little. The dotted line represents technology that’s ‘good enough’ to serve customers’ needs. Second, in every market there’s a distinctly different trajectory of improvement that companies provide as they introduce new and improved products. This pace of technological progress almost always outstrips the ability of customers in any given tier of the market to use it, as the more steeply sloping lines in the chart suggest. Accordingly, a company whose products are squarely positioned on mainstream customers’ current needs today will probably overshoot what those same customers are able to utilize in the future. This happens because companies keep striving to make better products that they can sell for higher profit margins to not-yet-satisfied customers in more demanding tiers of the market. The third critical element of the model is the distinction between sustaining and disruptive innovation. A sustaining innovation targets demanding, high-end customers with better performance than what was previously available. Some sustaining innovations are the incremental year-by-year improvements that all good companies produce. Other sustaining innovations are breakthrough, leapfrog(=sprongsgewijs)-beyond-the-competition products. It doesn’t matter how technologically difficult the innovation is, however: The established competitors almost always win the battles of sustaining technology. Because this strategy entails making a better product that they can sell for higher profit margins to their best customers, the established competitors have powerful motivations—and the resources—to fight and win sustaining battles. Disruptive innovations, in contrast, don’t attempt to bring better products to established customers in existing markets; rather, they disrupt and redefine that trajectory by introducing products and services that are not as good as currently available products. But disruptive technologies offer other benefits—typically, they are simpler, more convenient and less expensive products that appeal to new or less-demanding customers. Once the disruptive product gains a foothold in new or low-end markets, the improvement cycle begins. And because the pace of technological progress outstrips customers’ abilities to use it, the previously not-good-enough technology eventually improves enough to intersect with the needs of more demanding customers. When that happens, the disruptors are on their way to defeating the incumbents. This distinction is important for innovators seeking to create new-growth businesses. According to Christensen’s model, whereas current leaders of the industry almost always triumph in battles of sustaining innovation, successful disruptions have been launched most often by entrant companies.
