Algebra II Mathematician: Unit #4 Solving Polynomial Functions 5.8
Algebra II
Unit #4 Solving Polynomial Functions
5.8 Real-Life Applications
Mathematician: ____________________
**similar to the popcorn problem launch
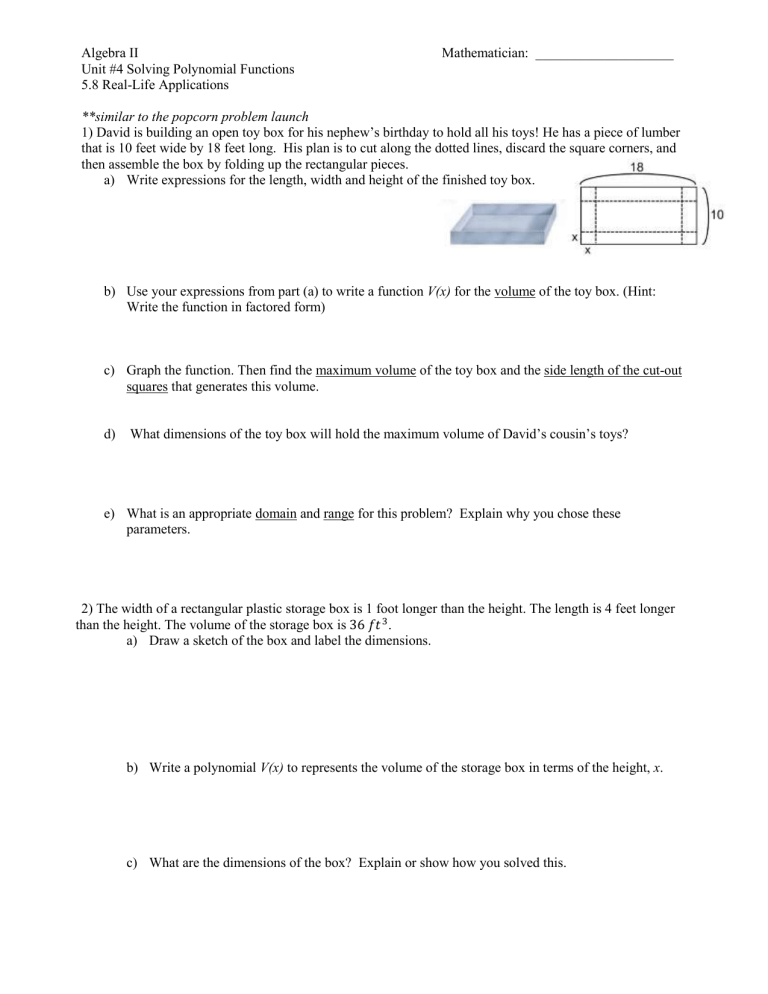
1) David is building an open toy box for his nephew’s birthday to hold all his toys! He has a piece of lumber that is 10 feet wide by 18 feet long. His plan is to cut along the dotted lines, discard the square corners, and then assemble the box by folding up the rectangular pieces. a) Write expressions for the length, width and height of the finished toy box. b) Use your expressions from part (a) to write a function V(x) for the volume of the toy box. (Hint:
Write the function in factored form) c) Graph the function. Then find the maximum volume of the toy box and the side length of the cut-out squares that generates this volume. d) What dimensions of the toy box will hold the maximum volume of David’s cousin’s toys? e) What is an appropriate domain and range for this problem? Explain why you chose these parameters.
2) The width of a rectangular plastic storage box is 1 foot longer than the height. The length is 4 feet longer than the height. The volume of the storage box is 36 𝑓𝑡
3
. a) Draw a sketch of the box and label the dimensions. b) Write a polynomial V(x) to represents the volume of the storage box in terms of the height, x . c) What are the dimensions of the box? Explain or show how you solved this.
3) The PRODUCT of three consecutive integers is 210. What are these numbers? Show your work!
4) The product of three consecutive even integers is 1680. Find the SUM of the numbers. Show your work!
5) The SUM of four consecutive integers is -26. What are the numbers?
6) The Johnson twins were born two years after their older sister. This year, the product of the three siblings’ ages is exactly 4,558 more than the sum of their ages. How old are the twins? a) Write an equation to represent this situation. Let x represent a twin’s age. b) Use a graph to determine the twin’s ages. Explain your solution process. c) How old is their sister? __________
Things to Remember:
Polynomial Regression Models – Using the Calculator
In my own words:
This means:
If you have 2 data points, you can find a _______ - degree, ________________ model for the data.
If you have 3 data points, you can find a _______ - degree, ________________ model for the data.
If you have 4 data points, you can find a _______ - degree, ________________ model for the data.
If you have 5 data points, you can find a _______ - degree, ________________ model for the data.
Example: Find a polynomial function to model the function that passes through the points (0, −1), (−1, −7), (2, 17), and (−2, −27).
1) Make a scatterplot of the data points on the grid. Include both scales.
2) Determine what SHAPE the function appears to take
(linear, quadratic, cubic, quartic)
3) Find a polynomial model using your calculator’s regression functions: a.
Enter data values into your calculator’s LIST.
Commands: ________ - __________. b.
Graph your scatterplot. Make sure the STAT PLOT is turned on.
Commands: 2 ND – Y= - turn plots “on” c.
Use your calculator’s regression function s to determine the coefficient values a , b , c , d for the polynomial function
Commands: ________ - _________ - Select which model you want!
a = _______ b = ________ c = ________ d = ________ R 2 = __________ f(x) = _______________________________________________
**R 2 tells strength of the correlation: the closer R 2 is to 1, the stronger the correlation which means the function is a “better fit”
(if you don’t see an R 2 value go to the catalog 2 ND - 0 and select “diagnostics on”) d.
Type your function rule into Y = to graph the function along with the points. It should pass through them…or be really close “curve of best fit”
Example 2: Find a polynomial model that passes through the points
(-2, 39.25), (-1, 6.25), (0, 2), (1, 4.75).
Shape: __________________________ f(x) = __________________________________________
R
2
= _____________
Regression Calculator Practice
Use your calculator to make a scatterplot of the data. Then find function’s curve of “best fit.” Identify the shape of the function (linear/quadratic/cubic/quartic) each data set represents. Record the R 2 value to determine the strength of the correlation. Then, evaluate the function at the given input values.
1.
(1, −4), (−2, 38), (0, 2), and (−1, 10) 2. (1, −5), (−3, 39), and (0, –6)
Shape: _________________________________ f(x) = ________________________________
R 2 = ______________ f(5) = ___________ f(-3) = _____________
Shape: _________________________________ f(x) =
R 2 =
_____________________________
______________ f(2) = ____________ f(-7) = _____________
Real-Life Applications:
Example 1: The table shows winning times in the 400-meter run at a state track meet.
**Let x = the number of years since 2001 and y = the number of seconds.
Graph a scatterplot of the data. Adjust your window to see all points.
Use your calculator to write linear, quadratic, and cubic models for the data ( round to the hundredths) .
Record the R 2 value.
Linear: f(x) = _____________________________________________ R
2
= _____________
Quadratic: f(x) = _____________________________________________ R
2
= _____________
Cubic: f(x) = _____________________________________________ R
2
= _____________
Which model appears to be the best fit? Explain your decision.
Use this model to estimate the winning time in 2013 ( x= ____). Does this seem like a reasonable prediction? Explain why or why not using specific data.
More Practice with Regressions:
1.
The table shows the percent of on-time flights for selected years. Find a polynomial function to model the data. Let x represent the years after 1990.
a. What types of models can you find for the data? ____________________________________ b. Which model will fit the data points EXACTLY/PERFECTLY? ________________________________ c.
Find R 2 for the models you listed in (a).
What does the value of r 2 or R 2 tell you about each model? d . Graph each model on your calculator and show them on the scatterplot to the right (label each) e. Which model seems more likely to represent the percent of on-time flights over time in real life? Explain your answer.
2.
The table shows winning points in men’s springboard diving. Let x represent the years after 1980. a.
Find a linear, quadratic, and cubic model for the data. Which model best fits the data?
Linear: f(x) = __________________________________________ R
2
= _____________
Quadratic: f(x) = __________________________________________ R
2
= _____________
Cubic: f(x) = __________________________________________ R
2
= _____________ b.
Use the model of best fit to estimate the diving record in 2005(x = ___) and then in 2018 (x = _). Do these estimates seem reasonable? Explain why or why not with specific data.
3.
Woody Forester has the job of figuring out how much lumber can be obtained from various sizes of monkey-puzzle trees. From sawmill records he finds the following numbers of board-feet lumber can be cut from trees of the given diameters:
Diameter (feet) Lumber (board-feet)
1 10
2 99
3
4
324
745
**Since board-feet is cubic measurement, Woody thinks a cubic function will be a reasonable model.** a) Find the cubic polynomial function expressing board-feet in terms of diameter. Use function notation. b) How much lumber can be obtained from a tree with a trunk five feet in diameter? Show your work/explain how you found the answer. c) If Woody obtained 42,925 cubic feet of lumber, what was the diameter of the tree they cut down?
Explain how you found this answer. d) Woody finds that the function in part (a) has one integer zero which is ___________. Determine the other two zeros by using synthetic division and the quadratic formula. Show your work!
4.
Find a cubic and quartic model for each set of data. Then determine which model is the best fit and explain your choice. a.
b.
Cubic: _________________________________
Quartic: ________________________________
“
Best Fit
”
and why:
Cubic: _________________________________
Quartic: ________________________________
“
Best Fit
”
and why:
MathXL 5.8 – This is due (unless 100% of the class had the packet done???)

