Nob Hill Crime Statistics September 2015
advertisement
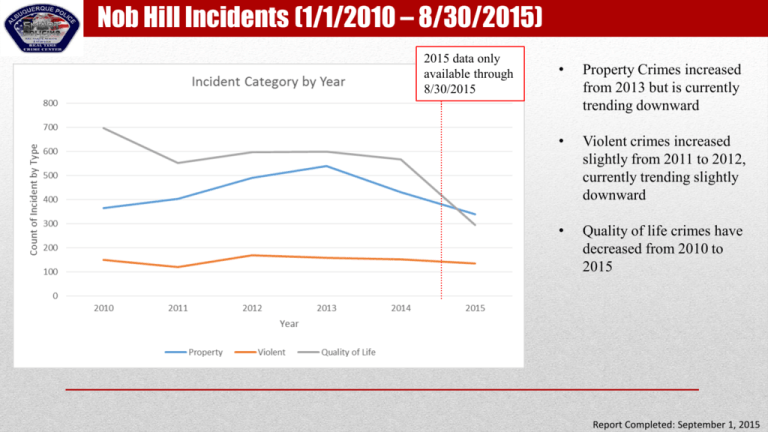
Nob Hill Incidents (1/1/2010 – 8/30/2015) 2015 data only available through 8/30/2015 • Property Crimes increased from 2013 but is currently trending downward • Violent crimes increased slightly from 2011 to 2012, currently trending slightly downward • Quality of life crimes have decreased from 2010 to 2015 Report Completed: September 1, 2015 Nob Hill Incidents (1/1/2010 – 8/30/2015) Jan 1 – 2014 Aug 30, 2015 2010 2011 2012 2013 Property* 364 403 491 539 432 340 Violent** 149 120 170 158 152 134 Quality of Life*** 697 553 597 599 568 294 3220 3087 3270 3309 3166 2783 Total *Property includes Auto Burglary, Auto Theft, Commercial Burglary, Residential Burglary, Larceny, & Shoplifting **Violent includes Robbery, Homicide, Weapons, Sex Crimes, Arson, Suicide, Assault, & Domestic Violence ***Quality of Life includes all other crime reports (except traffic) Report Completed: September 1, 2015 Nob Hill Incidents (1/1/2010 – 8/30/2015) 2015 data only available through 8/30/2015 • Most property crimes are trending down. Upward trend in Auto Theft in 2015 to date. • Commercial burglary is trending downward since peaking in 2013. • Robbery numbers have remained relatively consistent. *Robbery is a catchall category that may be either individual or commercial robbery Report Completed: September 8, 2015 Nob Hill Incidents (1/1/2010 – 8/30/2015) Jan 1 – 2014 Aug 30, 2015 2010 2011 2012 2013 Auto Burg 95 115 138 127 96 83 Auto Theft 40 48 35 59 44 54 Residential Burglary 70 72 107 84 85 71 Commercial Burglary 11 9 26 63 31 6 2 5 11 9 6 5 4 4 5 2 2 Individual Robbery Commercial Robbery Robbery* 19 5 5 *Robbery is a catchall category that may be either individual or commercial robbery Report Completed: September 8, 2015 3010 Monte Vista BL NE (1/4 mile buffer)** 2015 data only available through 8/30/2015 • Most property crimes are trending down. Slight upward trend in Residential Burglary. • Commercial burglary is trending downward since peaking in 2013. • Robbery numbers have remained relatively consistent. *Robbery is a catchall category that may be either individual or commercial robbery Report Completed: September 8, 2015 3010 Monte Vista BL NE (1/4 mile buffer)** Jan 1 – 2014 Aug 30, 2015 2010 2011 2012 2013 46 67 46 48 49 30 Auto Theft 8 16 6 17 18 14 Residential Burglary 8 10 13 14 13 15 Commercial Burglary 4 6 6 15 14 4 Individual Robbery 1 4 5 5 5 Commercial Robbery 1 3 1 4 4 9 5 1 2 1 841 738 718 781 394 Auto Burglary Robbery* Total 734 *Robbery is a catchall category that may be either individual or commercial robbery **These numbers reflect incidents with ¼ mile of 3010 Monte Vista Bl NE Report Completed: September 8, 2015
