There are several aspects of the question, "is criminal justice just
advertisement
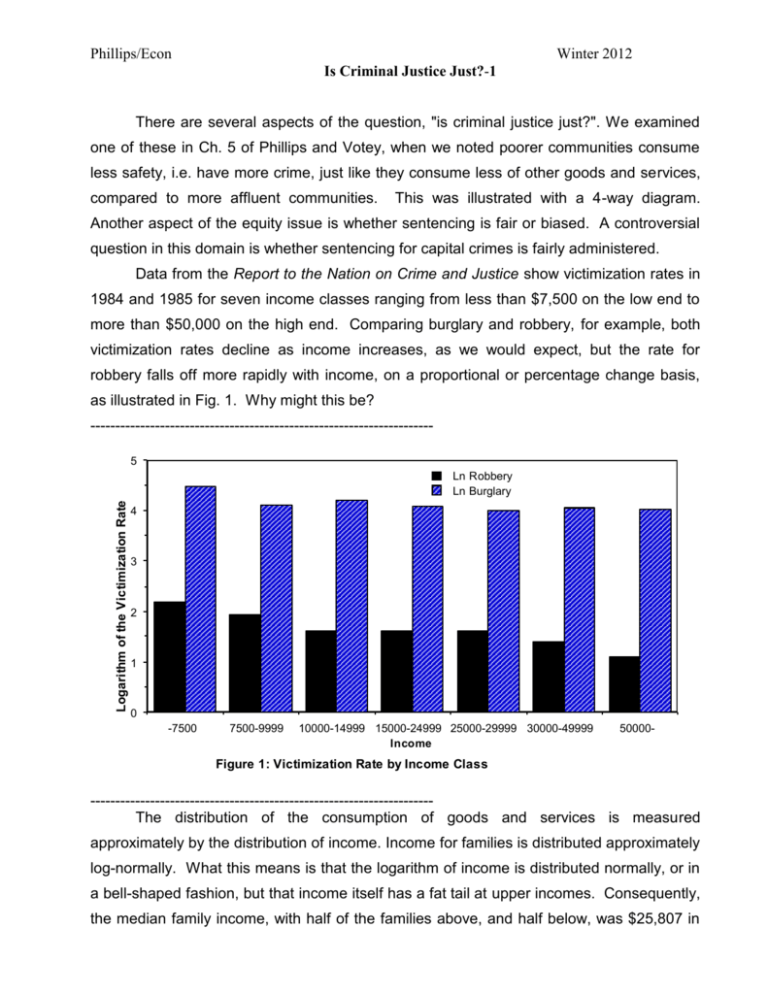
Phillips/Econ Winter 2012 Is Criminal Justice Just?-1 There are several aspects of the question, "is criminal justice just?". We examined one of these in Ch. 5 of Phillips and Votey, when we noted poorer communities consume less safety, i.e. have more crime, just like they consume less of other goods and services, compared to more affluent communities. This was illustrated with a 4-way diagram. Another aspect of the equity issue is whether sentencing is fair or biased. A controversial question in this domain is whether sentencing for capital crimes is fairly administered. Data from the Report to the Nation on Crime and Justice show victimization rates in 1984 and 1985 for seven income classes ranging from less than $7,500 on the low end to more than $50,000 on the high end. Comparing burglary and robbery, for example, both victimization rates decline as income increases, as we would expect, but the rate for robbery falls off more rapidly with income, on a proportional or percentage change basis, as illustrated in Fig. 1. Why might this be? --------------------------------------------------------------------5 Logarithm of the Victimization Rate Ln Robbery Ln Burglary 4 3 2 1 0 -7500 7500-9999 10000-14999 15000-24999 25000-29999 30000-49999 Income 50000- Figure 1: Victimization Rate by Income Class --------------------------------------------------------------------The distribution of the consumption of goods and services is measured approximately by the distribution of income. Income for families is distributed approximately log-normally. What this means is that the logarithm of income is distributed normally, or in a bell-shaped fashion, but that income itself has a fat tail at upper incomes. Consequently, the median family income, with half of the families above, and half below, was $25,807 in Phillips/Econ Winter 2012 Is Criminal Justice Just?-2 1985 while the mean or average family income of $32,944 was above this median since the average was raised by the relatively small number of fortunate families at high incomes. The cumulative distribution of family income in 1985, plotting the percentage of all families below each income level, is illustrated in Fig. 2. --------------------------------------------------------------------100 Cum. % Families 80 60 40 20 0 0 20000 40000 Income 60000 80000 Figure 2: Cumulativ e Distribution, US Family Income, 1985 --------------------------------------------------------------------A measure of inequality can be illustrated by a Lorenz curve, which plots the percentage of total family income that is received by a percentage of the families, going from the poorest to the richest. For example, the poorest 20% of families receive only 5% of total family income, while the poorest 40% receive only 16% of the total, etc., as illustrated in Fig. 3. The Lorenz curve can be calculated if the distribution of income is available. The correspondence between various analytical distributions of income, such as normal, equally probable (rectangular or uniform) and exponential, with their associated Lorenz curves, is illustrated in the figure attached to these notes. If total family income was divided equally among all families with each receiving the same amount, then the Lorenz curve would be a diagonal. The ratio of the area between the diagonal and the Lorenz curve to the area in the lower half of the box, as divided by the diagonal, is the Gini coefficient. If the distribution were perfectly equal, the Gini coefficient would be zero. It is about 0.36 in the United States compared to 0.31 in Japan, 0.41 in Italy, and 0.57 in India. Phillips/Econ Winter 2012 Is Criminal Justice Just?-3 120 Gini Coefficient= Area A/Area (A+B) Cum. % Income 100 80 60 40 A 20 B 0 0 20 40 60 80 100 120 Cum. % Families Figure 3: Lorenz Curv e, US Family Income, 1985 --------------------------------------------------------------------The cumulative percentage of families below the upper limit income for each of the seven income classes suffering robbery or burglary, is listed in Table 1, along with the (marginal) percentage in each class. The burglary and robbery rates for each class are also listed (as plotted in Fig. 1). The cumulative percentage of the total number of each crime's victims accounted for by that income class and lower income groups is also listed and used to plot Lorenz curves in Fig. 4. Note that since crime is a bad, the Lorenz curve lies above the diagonal. Note also that, as expected, from the victimization rates, the incidence of robbery is less fair than burglary. Why is this the case? Safety is both publicly and privately provided. In the case of burglary, the choice of location is a big factor in safety. Other privately provided components are locks, alarms, lighting, etc. A publicly provided service affecting safety is police car patrol and surveillance and response time. In the case of robbery, private choices, such as avoiding dangerous areas during leisure time, are a consideration and publicly provided services such as well lighted streets, police foot patrols, and the like are important. Economists distinguish between the nature of a good, whether it is public or private, and its provision. For example, a university education can be privately provided by Stanford or publicly provided by UC. A good that is totally private in its economic nature can only be consumed by one person. A good that is totally public in its economic nature is jointly consumed by all and Phillips/Econ Winter 2012 Is Criminal Justice Just?-4 ..................................................................................................................................... ... Cumulative Distribution of Families Income Class -7500 7500-9999 10000-14999 15000-24999 25000-29999 30000-49999 50000- Income Class -7500 7500-9999 10000-14999 15000-24999 25000-29999 30000-49999 50000- . . . . . 041 092 .223 482 583 824 1.000 Marginal Distribution of Families .041 .051 .131 .259 .101 .241 .176 Cumulative Distribution of Robbery Victims .0790 .1554 .2956 .5727 .6808 .8871 1.000 Robbery Rate Per 1000 Persons 9 7 5 5 5 4 3 Burglary Rate Per 1000 Households 86 67 67 59 54 58 56 Cumulative Distribution of Burglary Victims . . . . 0588 1099 2563 5113 .6023 .8355 1.000 Table 1: Distributions of Robbery & Burglary Victims by Income --------------------------------------------------------------------one person does not consume it or use it up. Education and safety are goods that have both a private and public nature. Home defense may be largely private, using up goods and services that could be used to defend other homes. But there is a public component even to privately provided defense. For example, many of the homes around mine are protected by private agencies such as WESTEC. I probably benefit without paying. This is the so-called "free-rider" problem associated with "public" goods. Safety from robbery, or safe streets, is probably mostly a "public" good. My walking down a safe street does not consume or use up "safeness". Robbery (or safety from being robbed) is probably more "public" while burglary is probably more "private". The "free-rider" problem associated with "public" goods often leads to their underproduction and under-consumption, an inefficiency problem. There is an incentive to let the other person pay for a "public" good. Consequently, the more "public" in nature the good, Phillips/Econ Winter 2012 Is Criminal Justice Just?-5 1.20e+0 Cumulative % Victims 1.00e+0 8.00e-1 Cum Robbery Cum Burglary 6.00e-1 4.00e-1 2.00e-1 2.71e-20 2.71e-20 2.00e-1 4.00e-1 6.00e-1 8.00e-1 1.00e+0 1.20e+0 Cumulativ e % Families Figure 4: "Lorenz" Curv es for Robbery & Burglary Victims ................................................................................................................................................ the more imperative that it is publicly provided. The production possibility frontier for "private" goods and "public" goods in society is illustrated in Fig. 5. The optimal point is A. The underproduction of "public" goods means we are probably at "B", with too many "private" goods relative to "public" goods. This was John Kenneth Galbraith's point in The Affluent Society. If robbery protection is "public" it is probably under-produced, with the more affluent reluctant to tax themselves to protect the less affluent. This may be why robbery rates rise so dramatically as income falls. In contrast, burglary protection is "private" and hence not under-produced, and burglary rates are fairly constant with income except for the lowest income class, where they rise rapidly probably because this class cannot afford "private" protection. Recall that the slope of the production possibility frontier is the ratio of the marginal costs or social values (prices) of the goods. For example, in Fig. 5, the slope of the production possibility frontier is the price of the public good relative to the price of the private good. Note that the slope at B, where the public good is under-produced, is less than the slope at A, the optimal mix of private and public goods. At B, the public good is Phillips/Econ Winter 2012 Is Criminal Justice Just?-6 Private Goods B - Underproduction of the Public Good A- Optimal Point Slope of the PPF is the Ratio of the Marginal Cost(Price} of the Public Good to the Marginal Cost(Price) of the Private Good- Note that at the Point B, the Public Good is Undervalued Production Possibility Frontier(PPF) Public Goods Figure 5: The Underproduction of Public Goods(Safety) ............................................................................................................................................. ............... under-valued relatively, reflecting the "free-rider" problem and the fact that people do not value public goods which also benefit others as much as they value private goods which benefit only themselves. This example of the contrast between burglary and robbery where we compare the variation of victimization rates with income illustrates the point made in the essay by Thurow that issues of equity and efficiency are often intertwined in complex ways. Lastly, with regard to the readings, the RAND study by Klein and all argues that when all conditioning factors are taken into account, there is no evidence of racial bias in sentencing in California. In contrast, the study by Myers and Sabol examines the historical record for the past century and a half and notes that incarceration rates have been much higher for blacks than for whites in our society, especially in the North. Lastly, in a book not assigned, Capital Punishment and the American Agenda, by Franklin Zimring and Gordon Hawkins, in chapter 4 they examine the question of "who should die?", or perhaps more accurately, who should receive a capital sentence?
