Re-expressing Data: Statistics Worksheet
advertisement
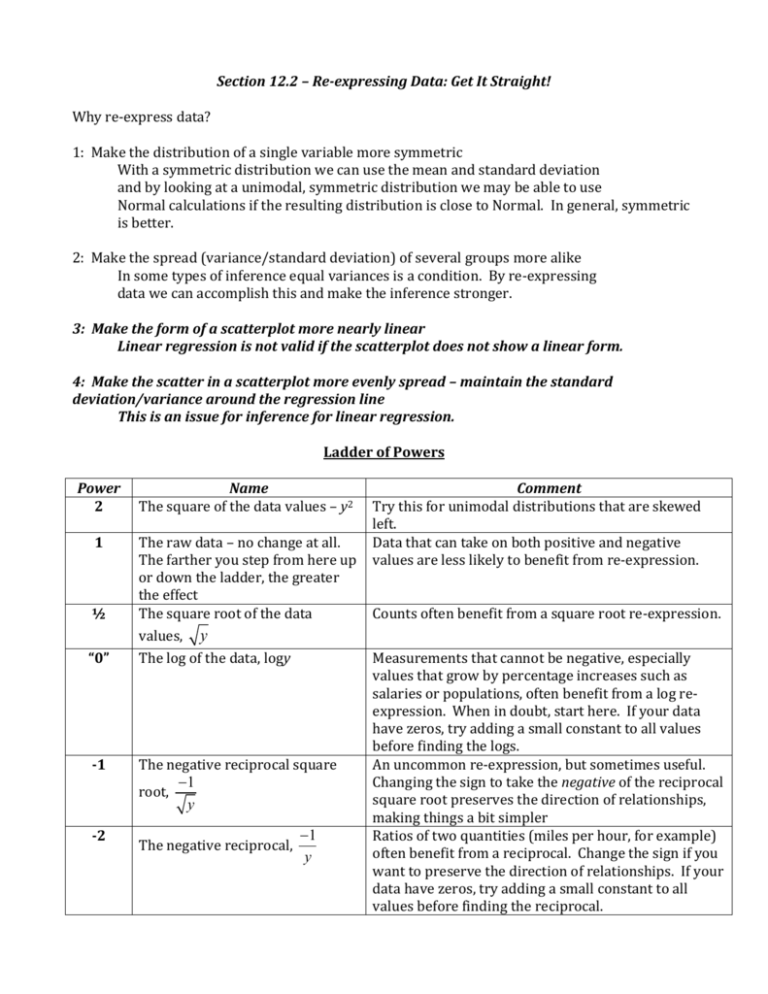
Section 12.2 – Re-expressing Data: Get It Straight! Why re-express data? 1: Make the distribution of a single variable more symmetric With a symmetric distribution we can use the mean and standard deviation and by looking at a unimodal, symmetric distribution we may be able to use Normal calculations if the resulting distribution is close to Normal. In general, symmetric is better. 2: Make the spread (variance/standard deviation) of several groups more alike In some types of inference equal variances is a condition. By re-expressing data we can accomplish this and make the inference stronger. 3: Make the form of a scatterplot more nearly linear Linear regression is not valid if the scatterplot does not show a linear form. 4: Make the scatter in a scatterplot more evenly spread – maintain the standard deviation/variance around the regression line This is an issue for inference for linear regression. Ladder of Powers Power 2 Name The square of the data values – y2 1 The raw data – no change at all. The farther you step from here up or down the ladder, the greater the effect The square root of the data values, y The log of the data, logy ½ “0” -1 -2 The negative reciprocal square -1 root, y The negative reciprocal, -1 y Comment Try this for unimodal distributions that are skewed left. Data that can take on both positive and negative values are less likely to benefit from re-expression. Counts often benefit from a square root re-expression. Measurements that cannot be negative, especially values that grow by percentage increases such as salaries or populations, often benefit from a log reexpression. When in doubt, start here. If your data have zeros, try adding a small constant to all values before finding the logs. An uncommon re-expression, but sometimes useful. Changing the sign to take the negative of the reciprocal square root preserves the direction of relationships, making things a bit simpler Ratios of two quantities (miles per hour, for example) often benefit from a reciprocal. Change the sign if you want to preserve the direction of relationships. If your data have zeros, try adding a small constant to all values before finding the reciprocal. Sometimes just manipulating the response variable is not enough. Often logs (as long as there are no negative or zero data values) we can use logs of both the x- and y- values. Model Name: Exponential x-axis x y-axis log (y) Logarithmic log(x) y Power log(x) log(y) Comment This model is the “0” power in the ladder approach, useful for values that grow by percentage increases A wide range of x-values, or a scatterplot descending rapidly at the left but leveling off toward the right, may benefit from trying this model. When one of the ladder’s powers is too big and the next is too small, this one may be just right. 6.5 EXAMPLES: Scientist Robert Boyle examined the relationship between the volume in which a gas is contained and the pressure in its container. He used a cylindrical container with a moveable top that could be raised or lowered to change the volume. He measured the Height in inches by counting equally spaced marks on the cylinder, and measured the Pressure in inches of mercury (as in a barometer). Some of his data are listed in the table. Create an appropriate model. Height 48 Pressure 29.1 44 31.9 40 35.3 36 39.3 32 44.2 28 50.3 24 58.8 20 70.7 18 77.9 16 87.9 14 12 100.4 117.6 A student experimenting with a pendulum counted the number of full swings the pendulum made in 20 seconds for various lengths of string. Her data are shown below. Length (in.) Number of swings 6.5 22 9 20 11.5 17 14.5 16 18 14 21 13 24 13 27 12 30 11 37.5 10 (a) Explain why a linear model is not appropriate for using the Length of a pendulum to predict the Number of Swings in 20 seconds. (b) Re-express the data to straighten the scatterplot. (c) Create an appropriate model. (d) Estimate the number of swings for a pendulum with a 48-inch string. (f) How much confidence do you place in this prediction? Why? Homework: p. 791 #s 43(skip b) & 44
