lab_thing - Homework Market
advertisement
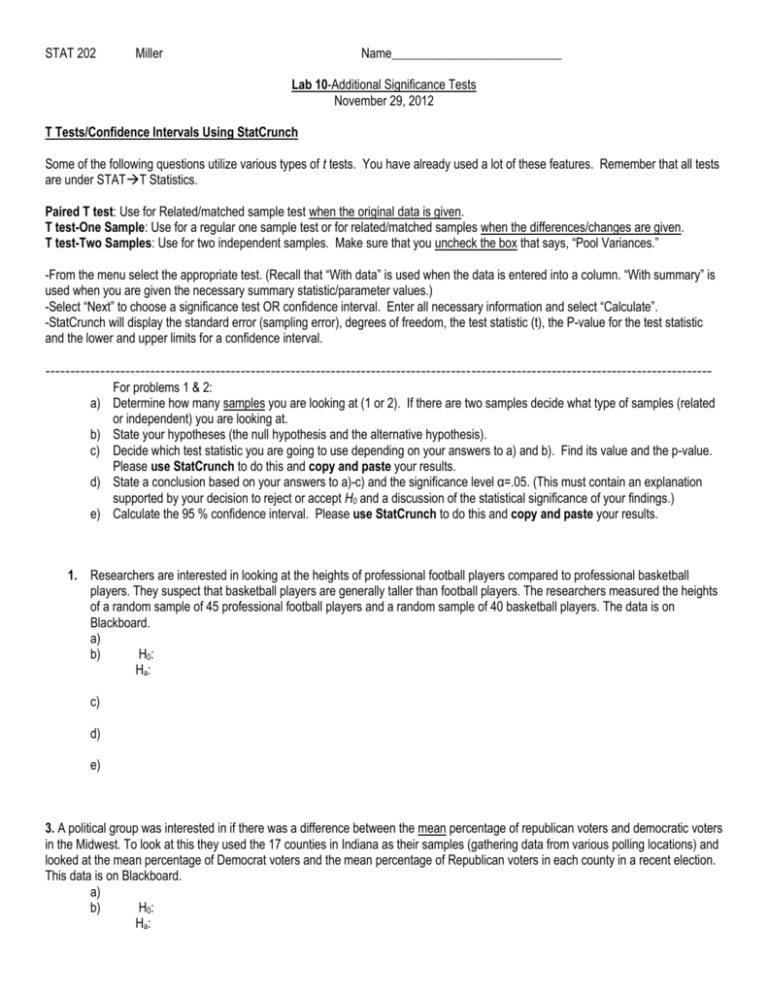
STAT 202 Miller Name___________________________ Lab 10-Additional Significance Tests November 29, 2012 T Tests/Confidence Intervals Using StatCrunch Some of the following questions utilize various types of t tests. You have already used a lot of these features. Remember that all tests are under STATT Statistics. Paired T test: Use for Related/matched sample test when the original data is given. T test-One Sample: Use for a regular one sample test or for related/matched samples when the differences/changes are given. T test-Two Samples: Use for two independent samples. Make sure that you uncheck the box that says, “Pool Variances.” -From the menu select the appropriate test. (Recall that “With data” is used when the data is entered into a column. “With summary” is used when you are given the necessary summary statistic/parameter values.) -Select “Next” to choose a significance test OR confidence interval. Enter all necessary information and select “Calculate”. -StatCrunch will display the standard error (sampling error), degrees of freedom, the test statistic (t), the P-value for the test statistic and the lower and upper limits for a confidence interval. ------------------------------------------------------------------------------------------------------------------------------------For problems 1 & 2: a) Determine how many samples you are looking at (1 or 2). If there are two samples decide what type of samples (related or independent) you are looking at. b) State your hypotheses (the null hypothesis and the alternative hypothesis). c) Decide which test statistic you are going to use depending on your answers to a) and b). Find its value and the p-value. Please use StatCrunch to do this and copy and paste your results. d) State a conclusion based on your answers to a)-c) and the significance level α=.05. (This must contain an explanation supported by your decision to reject or accept H0 and a discussion of the statistical significance of your findings.) e) Calculate the 95 % confidence interval. Please use StatCrunch to do this and copy and paste your results. 1. Researchers are interested in looking at the heights of professional football players compared to professional basketball players. They suspect that basketball players are generally taller than football players. The researchers measured the heights of a random sample of 45 professional football players and a random sample of 40 basketball players. The data is on Blackboard. a) b) H0: Ha: c) d) e) 3. A political group was interested in if there was a difference between the mean percentage of republican voters and democratic voters in the Midwest. To look at this they used the 17 counties in Indiana as their samples (gathering data from various polling locations) and looked at the mean percentage of Democrat voters and the mean percentage of Republican voters in each county in a recent election. This data is on Blackboard. a) b) H0: Ha: c) d) e) Z tests/Confidence Intervals for Proportions Using StatCrunch Some problems will require you to use significance tests for proportions. Select the appropriate test by going to STAT->Proportions (One Sample or Two Sample). -“With Data” means that you have the actual data values entered into a column in StatCrunch. This is categorical data so each data value will be one of the given categories. (StatCrunch will automatically determine the sample proportion(s), sample size(s) and standard error. ) -“With Summary” means that you are given the number of successes (X) or sample proportions and the sample size(s). -Click “Next” to either enter the correct hypotheses or to calculate a confidence interval. For a test based on one sample, enter the appropriate population proportion you are comparing the sample against. Then select the appropriate alternative hypothesis. Two sample tests only require that you choose the correct alternative hypothesis. For a confidence interval, select the level and just use the “Standard” method. -When you click “Calculate” the test statistic value and its P-value are reported and a confidence interval is reported by a lower and upper limit. ----------------------------------------------------------------------------------------------------------------------------------------------------------------------3. Gallup poll results released on November 29, 2012: “Democrats, Republicans Diverge on Capitalism, Federal Gov't Little difference on small business, free enterprise, entrepreneurs” (http://www.gallup.com/poll/158978/democrats-republicans-diverge-capitalism-federal-gov.aspx) Gallup collected information to see how Republicans and Democrats feel about various terms commonly associated with politics. The data for “Capitalism” is on Blackboard. Please note that “1” indicates a “Positive” view and “0” represents a “Negative” view. Does the data support the poll’s headline (specifically the part about capitalism)? Please use a hypothesis test and include a discussion of statistical significance. You need to include your StatCrunch results below as well. H0: Ha: 4. Reported by Gallup on June 22, 2012 Headline: “Majority of Egyptians Want Military Out of Politics” Is the headline supported by the given poll results? You will want to look at the original article to get all of the necessary details (http://www.gallup.com/poll/155303/Majority-Egyptians-MilitaryPolitics.aspx). Please use a hypothesis test and include a discussion of statistical significance. You need to include your StatCrunch results below as well. H0: Ha:
