Locating Earthquake Epicenters: Practice Set
advertisement
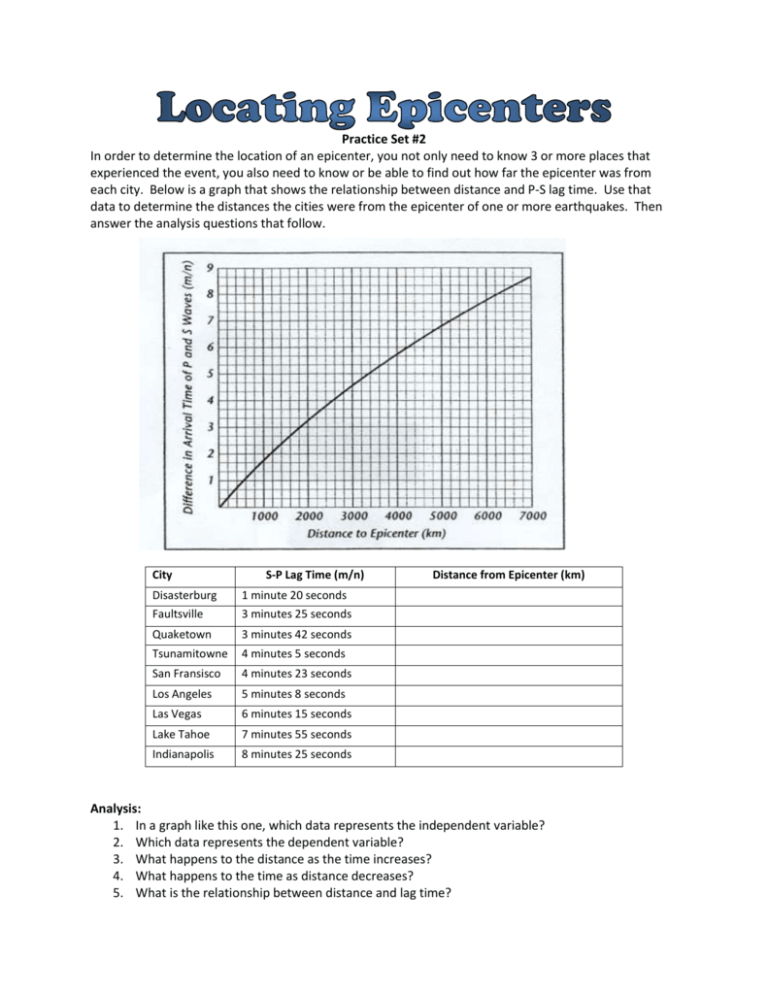
Practice Set #2 In order to determine the location of an epicenter, you not only need to know 3 or more places that experienced the event, you also need to know or be able to find out how far the epicenter was from each city. Below is a graph that shows the relationship between distance and P-S lag time. Use that data to determine the distances the cities were from the epicenter of one or more earthquakes. Then answer the analysis questions that follow. City S-P Lag Time (m/n) Disasterburg 1 minute 20 seconds Faultsville 3 minutes 25 seconds Quaketown 3 minutes 42 seconds Tsunamitowne 4 minutes 5 seconds San Fransisco 4 minutes 23 seconds Los Angeles 5 minutes 8 seconds Las Vegas 6 minutes 15 seconds Lake Tahoe 7 minutes 55 seconds Indianapolis 8 minutes 25 seconds Distance from Epicenter (km) Analysis: 1. In a graph like this one, which data represents the independent variable? 2. Which data represents the dependent variable? 3. What happens to the distance as the time increases? 4. What happens to the time as distance decreases? 5. What is the relationship between distance and lag time?
