Fluorescence Techniques
advertisement
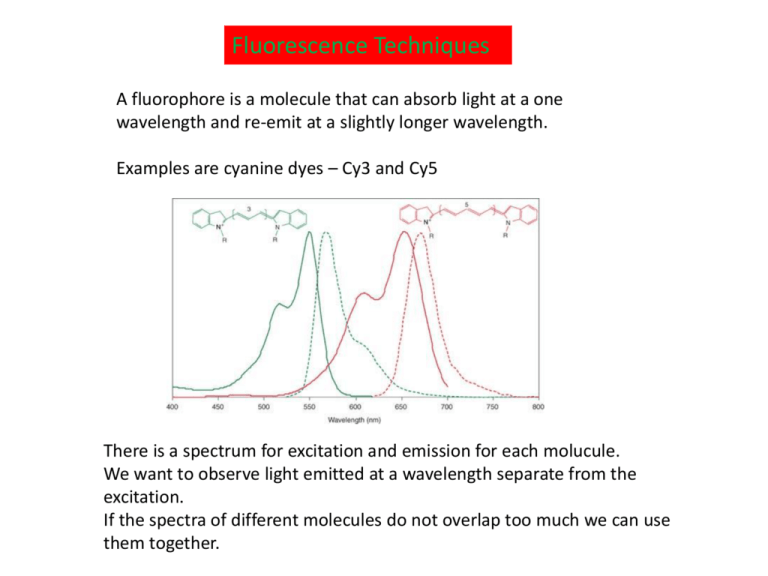
Fluorescence Techniques A fluorophore is a molecule that can absorb light at a one wavelength and re-emit at a slightly longer wavelength. Examples are cyanine dyes – Cy3 and Cy5 There is a spectrum for excitation and emission for each molucule. We want to observe light emitted at a wavelength separate from the excitation. If the spectra of different molecules do not overlap too much we can use them together. Fluorescence Microscopy Image of African Green Monkey Kidney Fibroblast Cells Simultaneous labelling of different parts of a cell with different fluorophores Red – filamentous actin network Green - lectin binding to the Golgi apparatus Blue – DNA in the nucleus Green Fluorescent Protein – occurs naturally in jellyfish The structure of GFP is a beta barrel with a chromophore in the centre. Variant fluorescent proteins have been developed with slightly different structures and peak wavelengths GFP-fusion proteins can be expressed in many organisms and used to visualize different parts of a cell or different kinds of cell Green = GFP-actin in a leaf cell Red = chloroplasts GFP illuminates the musclecontrolling nerve cells in a C. elegans Förster Resonance Energy Transfer - FRET A donor molecule is excited and can emit (green). Energy can be transmitted to the acceptor if they are close. The acceptor emits at a longer wavelength (red) Measure both green and red emissions. High red signal means donor and acceptor are close. High green signal means they are far apart. Possible FRET pairs would be Cy3 and Cy5 or two types of Fluorescent protein. There needs to be overlap between the emission spectrum of the donor and the excitation spectrum of the acceptor. Three possible uses of FRET Example from the Blanchard paper on tRNAs and the ribosome Photobleaching is damage to the fluorphore caused by high energy absorption. This stops it fluorescing. FRAP measures dynamics of mobile labelled molecules – e.g. lipids in a membrane move back into the area that was bleached Stochastic Optical Reconstruction Microscopy – STORM taken from http://www.microscopyu.com/articles/superresolution/stormintro.html Superresolution imaging of microtubules with STORM Fluorescently labelled antibodies bind to tubulin and reveal the position of the tubulin. Left – Conventional Fluorescence microspcopy image (collecting light from all the fluorophores simultaneously) STORM image – localizing each fluorophore separately and making an image with a dot at the position of each one. Diffraction of point source viewed through a circular aperture A point source viewed through a circular aperture (microscope objective) gives an Airy ring pattern because of diffraction. Also called Point Spread Function This can be approximated reasonably well by a Gaussian (ignoring the outer rings). Resolution is the closest distance of two point spread functions that can be separated Resolution r = /(2 NA) For light microscopes this varies between about 2m and 200nm depending on the wavelength and the type of lens Localizing one fluorophore (a) Distribution of detected photons from a single source – standard deviation s (b) Crosses are mean position estimated by fitting a Gaussian to (a). Error in the mean should be s/N, where N photons are detected. Each cross is the mean position estimated from a separate activation cycle of the fluorophore. (c) Distribution of the crosses. This gives a “mean of the mean” and an estimate of the error in the mean. Single Molecule Optical Switch Bates et al (2005) Phys. Rev. Lett. 94, 108101 With a low level red beam, Cy5 fluoresces in the red. A strong red pulse switches the Cy5 into an “off” state where it no longer fluoresces. The Cy3 is an activator - A green pulse is absorbed by Cy3, and transmission of energy to Cy5 switches it back on.
