Exam 1a
advertisement
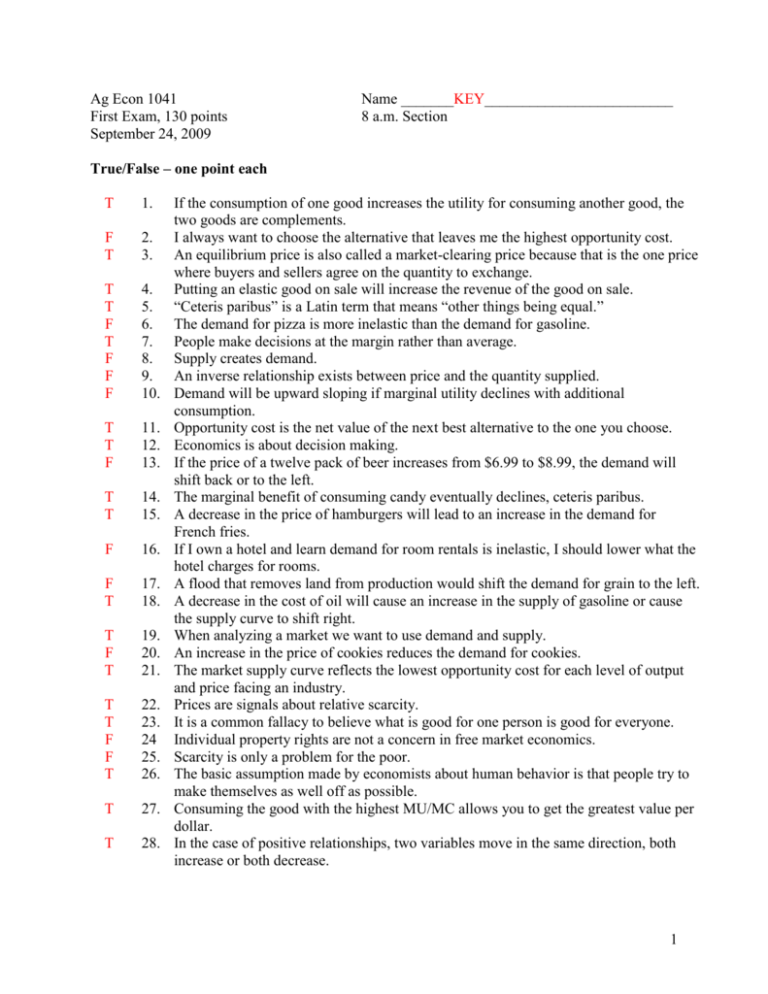
Ag Econ 1041 First Exam, 130 points September 24, 2009 Name _______KEY_________________________ 8 a.m. Section True/False – one point each T 1. F T 2. 3. T T F T F F F 4. 5. 6. 7. 8. 9. 10. T T F 11. 12. 13. T T 14. 15. F 16. F T 17. 18. T F T 19. 20. 21. T T F F T 22. 23. 24 25. 26. T 27. T 28. If the consumption of one good increases the utility for consuming another good, the two goods are complements. I always want to choose the alternative that leaves me the highest opportunity cost. An equilibrium price is also called a market-clearing price because that is the one price where buyers and sellers agree on the quantity to exchange. Putting an elastic good on sale will increase the revenue of the good on sale. “Ceteris paribus” is a Latin term that means “other things being equal.” The demand for pizza is more inelastic than the demand for gasoline. People make decisions at the margin rather than average. Supply creates demand. An inverse relationship exists between price and the quantity supplied. Demand will be upward sloping if marginal utility declines with additional consumption. Opportunity cost is the net value of the next best alternative to the one you choose. Economics is about decision making. If the price of a twelve pack of beer increases from $6.99 to $8.99, the demand will shift back or to the left. The marginal benefit of consuming candy eventually declines, ceteris paribus. A decrease in the price of hamburgers will lead to an increase in the demand for French fries. If I own a hotel and learn demand for room rentals is inelastic, I should lower what the hotel charges for rooms. A flood that removes land from production would shift the demand for grain to the left. A decrease in the cost of oil will cause an increase in the supply of gasoline or cause the supply curve to shift right. When analyzing a market we want to use demand and supply. An increase in the price of cookies reduces the demand for cookies. The market supply curve reflects the lowest opportunity cost for each level of output and price facing an industry. Prices are signals about relative scarcity. It is a common fallacy to believe what is good for one person is good for everyone. Individual property rights are not a concern in free market economics. Scarcity is only a problem for the poor. The basic assumption made by economists about human behavior is that people try to make themselves as well off as possible. Consuming the good with the highest MU/MC allows you to get the greatest value per dollar. In the case of positive relationships, two variables move in the same direction, both increase or both decrease. 1 T T 29. A combination of goods beyond the production possibilities curve cannot be produced currently. 30. Movement along the production possibilities curve shows the opportunity cost of producing more of a good. Matching – one point each L N M O K T J S I R H Q G P F E D C B A 31. 32. 33. 34. 35. 36. 37. 38. 39. 40. 41. 42. 43. 44. 45. 46. 47. 48. 49. 50. Margin Opportunity cost Utility Scarce good Demand Production possibilities Ceteris paribus Market Inelastic demand Quantity supplied Price Equilibrium Supply Production Comparative advantage Consumer goal Resources Substitute Revenue Inefficient A. B. C. D. E. F. G. H. I. J. K. L. M. N. O. P. Q. R. S. T. Below PPC Price x quantity sold A replacement Used for production MU/MCa = MU/MCb …. Lowest opportunity cost Direct or positive relationship of P & Q Signal to buyers and sellers P increase causes revenue increase Other variables unchanged Willingness and ability to buy Edge, where change occurs Value to individual(s) Foregone alternative(s) Has a price or cost Amount produced Qs = Qd Increases as price rises Where exchange is arranged What could be produced Multiple choice – one point each __D___ 51. Which of the following will not shift the demand curve for natural gas? a) a change in consumer income b) a change in average temperature settings c) a change in weather and heating requirements d) a change in the price of natural gas __A___ 52. Ceteris paribus, the demand curve for a normal good will shift to the left in response to a) a decrease in income b) a decrease in the price of the good c) an increase in the number of sellers d) all of the above 2 __B___ 53. Production combinations on the PPC are a) efficient but not obtainable b) efficient and attainable c) inefficient and obtainable d) inefficient and not obtainable __B___ 54. In general, the more resources devoted to technological research, the a) more the PPC will bow outward b) faster the PPC shifts outward c) higher the unemployment rate d) greater is current consumption __A___ 55. Which of the following does not help to organize trade? a) production possibility frontier b) markets c) property rights d) none of the above Short answer – five points each 56. Diagram the result in an industry where workers become more productive. P S0 S1 P0 P1 D Q0 Q1 Q 57. What is the goal of consumers? Maximize utility 58. The quantity supplied rises as a result of what? Price increase 59. Cory eats peanut butter and jelly more than hamburgers, which he consumes more than turkey sandwiches. Use the decision rule to explain why. MU pbj > MUh > MUt MC MC MC 3 60. Show with a diagram how prices would remain the same when the quantity exchanged increases. P S S1 P0 = P1 D 0 Q0 Q1 D1 Q 61. Using a demand schedule or graph, show the elastic and inelastic section of demand. Also show the corresponding marginal revenue. P P 1 2 3 elastic Q 3 2 1 Is okay inelastic D 0 Q MR 4 62. Draw a production possibilities curve for a firm that produces monitors and printers for personal computers. Assuming the firm is producing efficiently and not adding any resources, show what happens when it decides to produce more printers. Printers P1 P0 0 M1 M0 Monitors 63. Diagram what happens in the market for bicycles as gas prices rise and more bike paths are created. P S P1 P0 D 0 Q0 Q1 D1 Q 5 64. The supply of automobiles was relatively constant last year yet prices fell. Show the market results on a graph. P S P0 P1 D1 0 Q1 D0 Q0 Q 65. Show with a diagram why grain prices rise when there is a widespread drought. P S1 S0 P1 P0 D0 0 Q1 Q0 Q 6 66. I just received a raise. What will happen to my demand for my favorite style of food, BBQ? Why? D ↑; more income or ability to pay The following questions are valued at 10 points each 67. Finish the equation or statement a) % Δ Qd ÷ % Δ P = ___elasticity (coefficient)____________________________ b) If the % change in quantity demanded is greater than the relative change in price, demand is __elastic demand_____________________________ c) Demand reflects the ___consumer____________ side of the market. d) Marginal utility will eventually _decline or diminish________________________ e) P x Q = __(total) revenue_____________________ 68. Draw the situation and show market results when some people go to school, the quality of backpacks improves, the price of other book bags increases and income rises. On the same graph, include the result from lower material costs for producing backpacks. P S S1 P1 P0 D 0 Q0 Q1 D1 Q 7

