HW1
advertisement

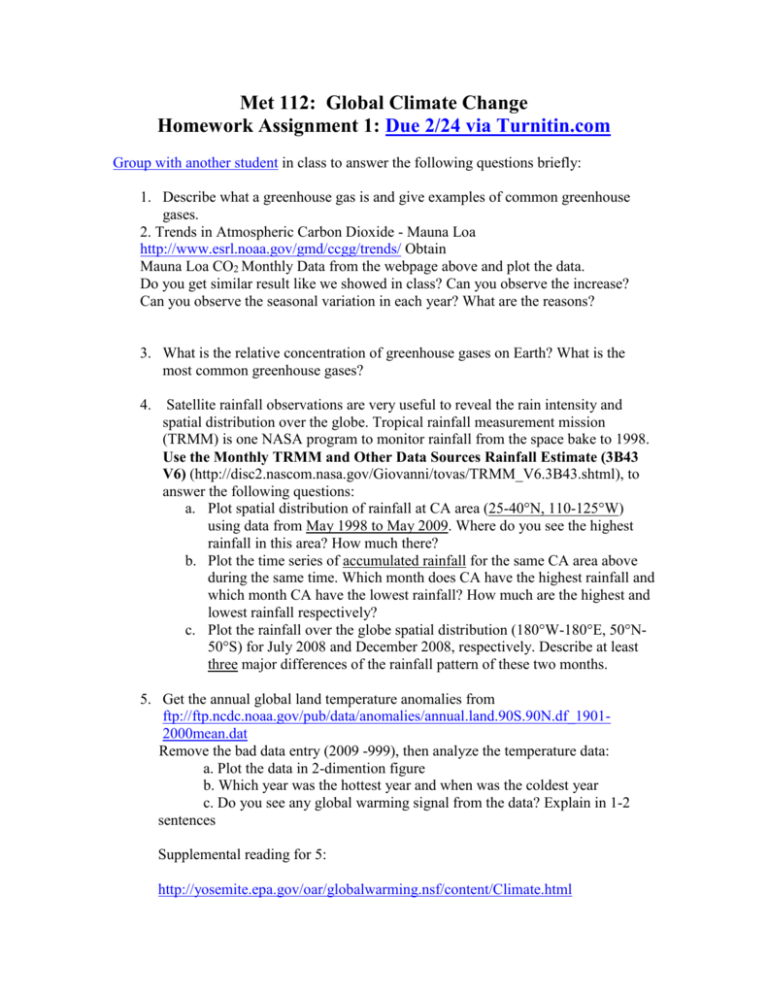
Met 112: Global Climate Change Homework Assignment 1: Due 2/24 via Turnitin.com Group with another student in class to answer the following questions briefly: 1. Describe what a greenhouse gas is and give examples of common greenhouse gases. 2. Trends in Atmospheric Carbon Dioxide - Mauna Loa http://www.esrl.noaa.gov/gmd/ccgg/trends/ Obtain Mauna Loa CO2 Monthly Data from the webpage above and plot the data. Do you get similar result like we showed in class? Can you observe the increase? Can you observe the seasonal variation in each year? What are the reasons? 3. What is the relative concentration of greenhouse gases on Earth? What is the most common greenhouse gases? 4. Satellite rainfall observations are very useful to reveal the rain intensity and spatial distribution over the globe. Tropical rainfall measurement mission (TRMM) is one NASA program to monitor rainfall from the space bake to 1998. Use the Monthly TRMM and Other Data Sources Rainfall Estimate (3B43 V6) (http://disc2.nascom.nasa.gov/Giovanni/tovas/TRMM_V6.3B43.shtml), to answer the following questions: a. Plot spatial distribution of rainfall at CA area (25-40°N, 110-125°W) using data from May 1998 to May 2009. Where do you see the highest rainfall in this area? How much there? b. Plot the time series of accumulated rainfall for the same CA area above during the same time. Which month does CA have the highest rainfall and which month CA have the lowest rainfall? How much are the highest and lowest rainfall respectively? c. Plot the rainfall over the globe spatial distribution (180°W-180°E, 50°N50°S) for July 2008 and December 2008, respectively. Describe at least three major differences of the rainfall pattern of these two months. 5. Get the annual global land temperature anomalies from ftp://ftp.ncdc.noaa.gov/pub/data/anomalies/annual.land.90S.90N.df_19012000mean.dat Remove the bad data entry (2009 -999), then analyze the temperature data: a. Plot the data in 2-dimention figure b. Which year was the hottest year and when was the coldest year c. Do you see any global warming signal from the data? Explain in 1-2 sentences Supplemental reading for 5: http://yosemite.epa.gov/oar/globalwarming.nsf/content/Climate.html http://www.epa.gov/globalwarming/kids/index.html http://earthobservatory.nasa.gov/Library/glossary.php3 http://www.ncdc.noaa.gov/oa/climate/research/anomalies/anomalies.html#sr05 “Global Surface Temperature Anomalies”


