Climatogram lab - Merrillville Community School
advertisement
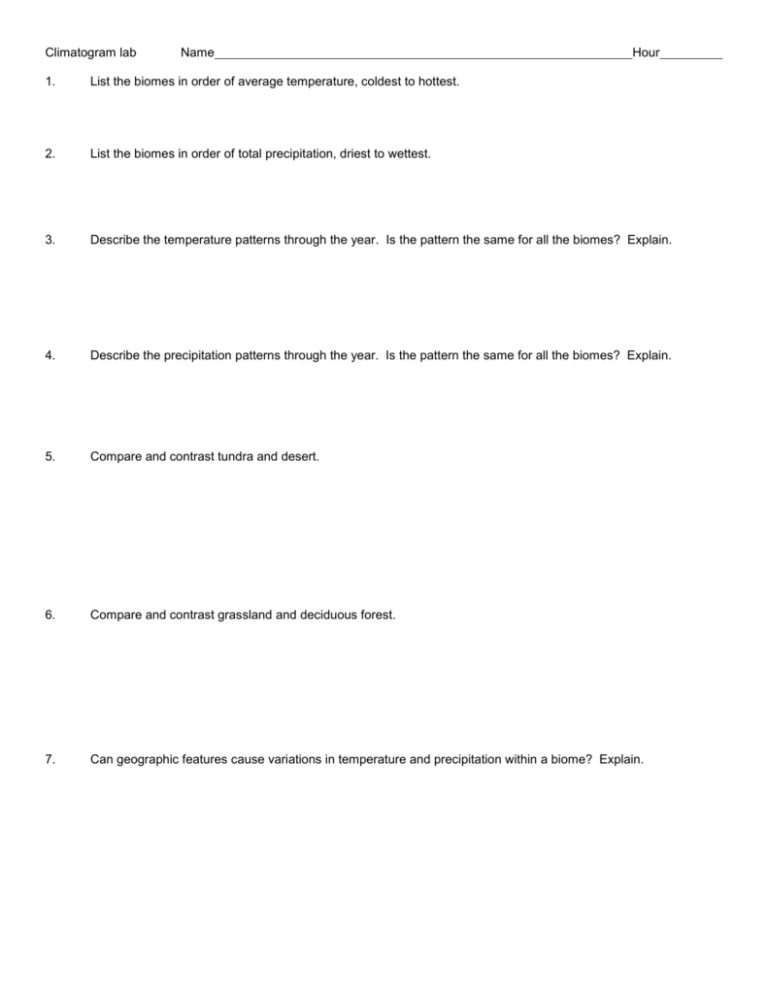
Climatogram lab Name Hour 1. List the biomes in order of average temperature, coldest to hottest. 2. List the biomes in order of total precipitation, driest to wettest. 3. Describe the temperature patterns through the year. Is the pattern the same for all the biomes? Explain. 4. Describe the precipitation patterns through the year. Is the pattern the same for all the biomes? Explain. 5. Compare and contrast tundra and desert. 6. Compare and contrast grassland and deciduous forest. 7. Can geographic features cause variations in temperature and precipitation within a biome? Explain. January February March April May June July August September October November December AVERAGE Tundra -27.0 -28.2 -26.0 -18.0 -9.0 2.0 4.0 3.0 -2.0 -10.0 -18.0 -24.5 -12.8 Coniferous Forest -11.0 -9.0 -6.0 0.0 6.0 12.0 13.0 12.0 8.0 2.0 -3.0 -11.0 1.1 Deciduous Forest 3.5 4.6 8.9 14.4 19.2 23.4 25.0 24.4 21.1 14.7 9.0 4.4 14.4 Tropical Rain Forest 25.6 25.6 24.4 25.0 24.4 23.3 23.3 24.4 24.4 25.0 25.6 25.6 24.7 Grassland -1.0 2.0 6.0 12.0 14.0 18.0 26.0 25.0 21.0 15.0 3.0 1.0 11.8 Desert -1.0 2.0 7.0 8.0 12.0 15.0 20.0 18.0 15.0 10.0 5.0 1.0 9.3 Deciduous Forest 8.5 8.4 9.5 7.9 9.1 9.6 11.7 10.8 9.3 7.6 6.8 8.4 107.6 Tropical Rain Forest 25.8 24.9 31.0 16.5 25.4 18.8 16.8 11.7 22.1 18.3 21.3 29.2 261.8 Grassland 3.0 1.0 5.5 8.5 12.0 11.8 8.5 11.5 8.2 5.5 4.5 3.5 83.5 Desert 2.5 3.0 1.8 1.0 1.0 0.8 0.5 0.5 0.4 0.6 1.8 2.2 16.1 Average Precipitaton (centimeters) January February March April May June July August September October November December TOTAL Tundra 0.5 0.5 0.1 0.1 0.1 1.8 2.0 1.9 1.5 1.0 0.5 0.3 10.3 Coniferous Forest 1.8 1.5 1.5 1.0 1.5 2.2 3.8 6.5 7.0 4.5 2.3 2.0 35.6 AVERAGE TEMPERATURE BY MONTH AVERAGE PRECIPITATION BY MONTH
