Answers to Quick Questions
advertisement

Sue Student
ME 352, Problem Set 1, 7 Oct 2008
1
Answers to Quick Questions
284 n
1. Evaluate the expression 23.45sin 360
for n= 1, 74, 2004, 355
365
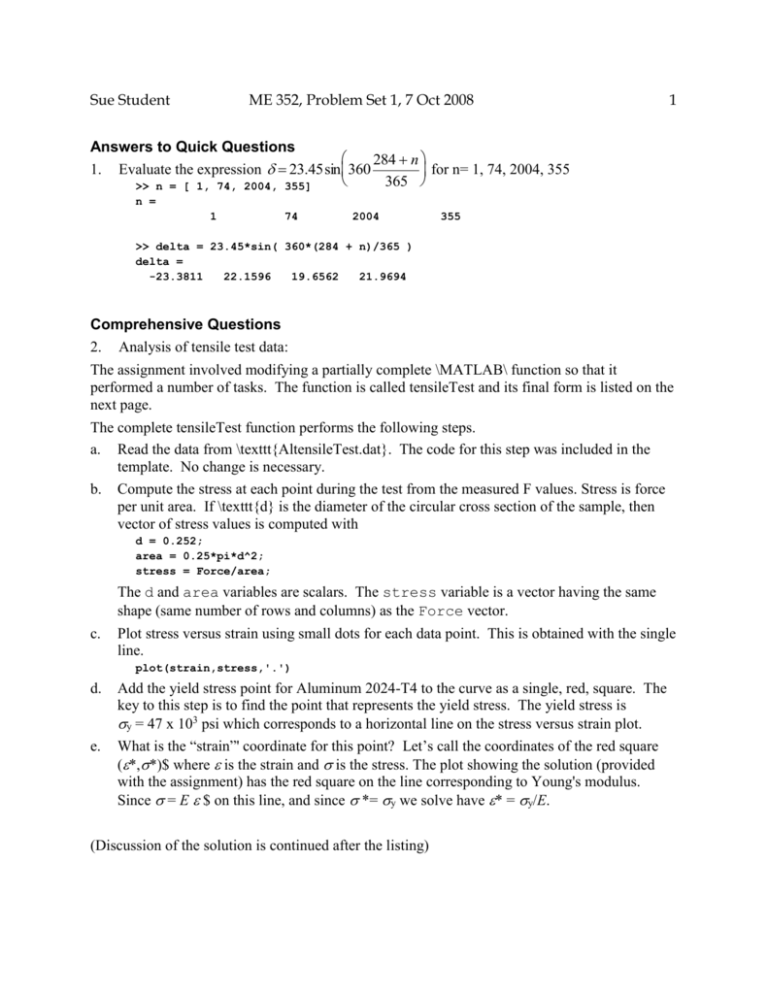
>> n = [ 1, 74, 2004, 355]
n =
1
74
2004
355
>> delta =
23.45*sin( 360*(284 + n)/365 )
delta =
-23.3811
22.1596
19.6562
21.9694
Comprehensive Questions
2. Analysis of tensile test data:
The assignment involved modifying a partially complete \MATLAB\ function so that it
performed a number of tasks. The function is called tensileTest and its final form is listed on the
next page.
The complete tensileTest function performs the following steps.
a. Read the data from \texttt{AltensileTest.dat}. The code for this step was included in the
template. No change is necessary.
b. Compute the stress at each point during the test from the measured F values. Stress is force
per unit area. If \texttt{d} is the diameter of the circular cross section of the sample, then
vector of stress values is computed with
d = 0.252;
area = 0.25*pi*d^2;
stress = Force/area;
The d and area variables are scalars. The stress variable is a vector having the same
shape (same number of rows and columns) as the Force vector.
c.
Plot stress versus strain using small dots for each data point. This is obtained with the single
line.
plot(strain,stress,'.')
d.
e.
Add the yield stress point for Aluminum 2024-T4 to the curve as a single, red, square. The
key to this step is to find the point that represents the yield stress. The yield stress is
y = 47 x 103 psi which corresponds to a horizontal line on the stress versus strain plot.
What is the “strain”' coordinate for this point? Let’s call the coordinates of the red square
(*,*)$ where is the strain and is the stress. The plot showing the solution (provided
with the assignment) has the red square on the line corresponding to Young's modulus.
Since = E $ on this line, and since *=y we solve have * = y/E.
(Discussion of the solution is continued after the listing)
Sue Student
ME 352, Problem Set 1, 7 Oct 2008
List of tensileTest.m:
function [sigmaMax,tmax] = tensileTest
% tensileTest Load and plot tensile test data
%
ME 352, Problem Set #1, 7 October 2003
% --- Load data from file
D = load('AltensileTest.dat');
t = D(:,1);
% time (s)
strain = D(:,2);
% strain (in/in)
Force = D(:,3);
% load (lbf)
% --- Compute stress
d = 0.252;
area = 0.25*pi*d^2;
stress = Force/area;
%
%
sample diameter (in)
sample cross section
% --- Known material properties
E = 10.6e6;
% Young's modulus for 2024-T4 Aluminum
yield = 47e3;
% Yield strength for 2024-T4 Aluminum
% --- Find intersection of horizontal line at stress = yield with line
%
having slope E (Young's modulus) that passes through zero
epsStar = yield/E;
sigStar = epsStar*E;
% --- Plot curves and label axes
plot(strain,stress,'.',epsStar,sigStar,'rs',[0 epsStar],[0 sigStar],'--')
xlabel('Strain (in/in)');
ylabel('Stress (psi)');
% --- Find the maximum stress and the time of the last recorded measurement
sigmaMax = max(stress);
tmax = t(end);
2
Sue Student
ME 352, Problem Set 1, 7 Oct 2008
3
f. The red square is added to the plot with these statements
epsStar = yield/E;
sigStar = epsStar*E;
plot(strain,stress,'.',epsStar,sigStar,'rs')
g.
Draw a dashed line indicating the Young's Modulus for Aluminum 2024-T4. This is easy
when the coordinates of the red square are known. We can define two element vectors with
the coordinates of this line and then add it to the plot
xline = [0 epsStar];
yline = [0 sigStar];
plot(strain,stress,'.',epsStar,sigStar,'rs',xline,yline,'--')
or we can put the vectors directly in the input argument to the plot statement like this
plot(strain,stress,'.',epsStar,sigStar,'rs',[0 epsStar],[0 sigStar],'--')
h.
Label the $x$ axis ``Strain (in/in)'' and the $y$ axis ``Stress (psi)''.
xlabel('Strain (in/in)');
ylabel('Stress (psi)');
i.
Find sigmaMax the maximum stress for the data set, and tmax the time of the last
recorded measurement. Return both from sigmaMax and tmax from the function. Do not
print sigmaMax and tmax from within the function.
sigmaMax = max(sigma);
tmax = t(end);
Running tensileTest produces the following text output and the plot in Figure 1.
>> [smax,tmax] = tensileTest
smax =
5.9902e+004
tmax =
231.7500
Sue Student
Figure 1
ME 352, Problem Set 1, 7 Oct 2008
Plot of stress versus strain created by the tensileTest function.
4


