North Coast Salmon Update - North Coast Steelhead Alliance
advertisement
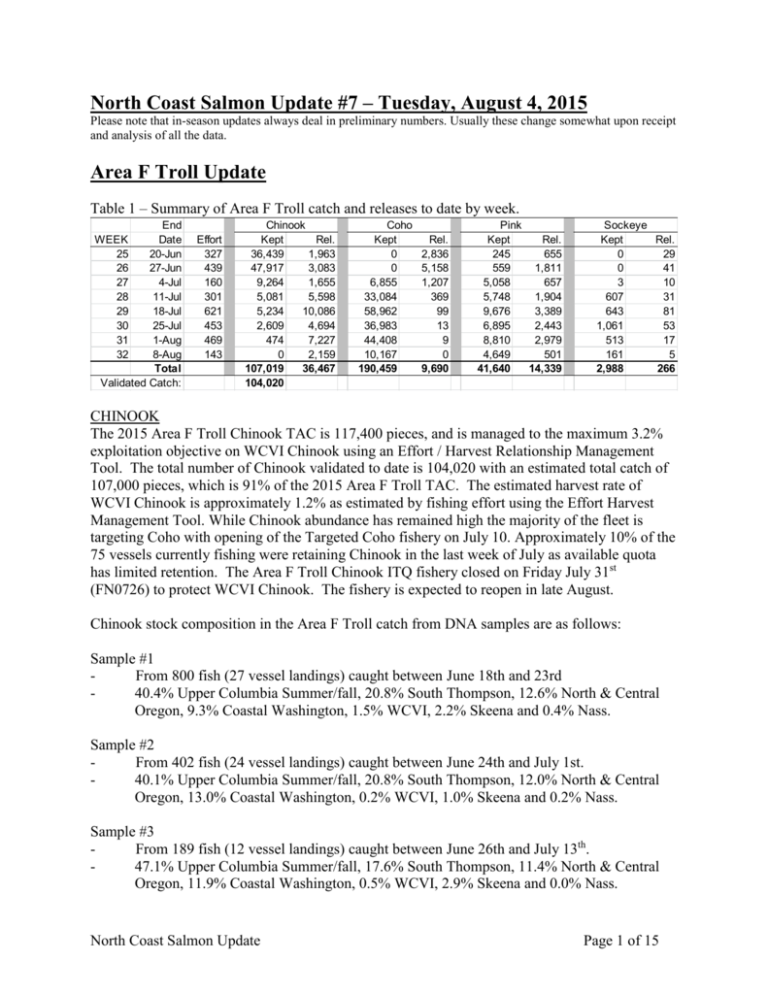
North Coast Salmon Update #7 – Tuesday, August 4, 2015 Please note that in-season updates always deal in preliminary numbers. Usually these change somewhat upon receipt and analysis of all the data. Area F Troll Update Table 1 – Summary of Area F Troll catch and releases to date by week. End Date 20-Jun 27-Jun 4-Jul 11-Jul 18-Jul 25-Jul 1-Aug 8-Aug Total Validated Catch: WEEK 25 26 27 28 29 30 31 32 Effort 327 439 160 301 621 453 469 143 Chinook Kept Rel. 36,439 1,963 47,917 3,083 9,264 1,655 5,081 5,598 5,234 10,086 2,609 4,694 474 7,227 0 2,159 107,019 36,467 104,020 Coho Kept 0 0 6,855 33,084 58,962 36,983 44,408 10,167 190,459 Rel. 2,836 5,158 1,207 369 99 13 9 0 9,690 Pink Kept Rel. 245 655 559 1,811 5,058 657 5,748 1,904 9,676 3,389 6,895 2,443 8,810 2,979 4,649 501 41,640 14,339 Sockeye Kept Rel. 0 29 0 41 3 10 607 31 643 81 1,061 53 513 17 161 5 2,988 266 CHINOOK The 2015 Area F Troll Chinook TAC is 117,400 pieces, and is managed to the maximum 3.2% exploitation objective on WCVI Chinook using an Effort / Harvest Relationship Management Tool. The total number of Chinook validated to date is 104,020 with an estimated total catch of 107,000 pieces, which is 91% of the 2015 Area F Troll TAC. The estimated harvest rate of WCVI Chinook is approximately 1.2% as estimated by fishing effort using the Effort Harvest Management Tool. While Chinook abundance has remained high the majority of the fleet is targeting Coho with opening of the Targeted Coho fishery on July 10. Approximately 10% of the 75 vessels currently fishing were retaining Chinook in the last week of July as available quota has limited retention. The Area F Troll Chinook ITQ fishery closed on Friday July 31st (FN0726) to protect WCVI Chinook. The fishery is expected to reopen in late August. Chinook stock composition in the Area F Troll catch from DNA samples are as follows: Sample #1 From 800 fish (27 vessel landings) caught between June 18th and 23rd 40.4% Upper Columbia Summer/fall, 20.8% South Thompson, 12.6% North & Central Oregon, 9.3% Coastal Washington, 1.5% WCVI, 2.2% Skeena and 0.4% Nass. Sample #2 From 402 fish (24 vessel landings) caught between June 24th and July 1st. 40.1% Upper Columbia Summer/fall, 20.8% South Thompson, 12.0% North & Central Oregon, 13.0% Coastal Washington, 0.2% WCVI, 1.0% Skeena and 0.2% Nass. Sample #3 From 189 fish (12 vessel landings) caught between June 26th and July 13th. 47.1% Upper Columbia Summer/fall, 17.6% South Thompson, 11.4% North & Central Oregon, 11.9% Coastal Washington, 0.5% WCVI, 2.9% Skeena and 0.0% Nass. North Coast Salmon Update Page 1 of 15 Sample #4 From 185 fish (9 vessel landings) caught between July 10th and July 19th. 48.3% Upper Columbia Summer/fall, 14.9% Coastal Washington, 14.6% South Thompson, 14.6% North & Central Oregon, 1.9% Nass 1.8% Skeena and 0% WCVI. COHO The main targeted Coho Fishery opened July 10th (FN0592) with an allowance of sockeye bycatch (FN0593). Average daily effort over the last week was 68 vessels with a mean Coho CPUE of 84 Coho/Vessel/Day. Total catch to date is estimated to be 190,500 Coho, 41,500 Pinks and 3,000 Sockeye. The migration timing of Nass and Skeena Sockeye through the troll area is primarily during the month of July. Furthermore the prevalence of Fraser Sockeye within Dixon Entrance is expected to increase during August. This was observed in 2014 when the troll catch of Sockeye increased dramatically after the first week of August. The Area F Troll currently does not have any allocation of Fraser River Sockeye. Therefore Area F Troll is scheduled close to the retention of sockeye on August 7th (FN0780) to avoid interception of Fraser Sockeye. A comparison of Coho CPUE over the past decade and fleet distribution are depicted in the following graphs. Figure 1 Mean Weekly Catch Per Unit Effort (CPUE) in Area F Troll. CPUE = (# Coho Caught + # Coho Released) / Vessel / Day. North Coast Salmon Update Page 2 of 15 Figure 2 – Distribution of fishing effort of the Area F Troll Fleet by week. North Coast Salmon Update Page 3 of 15 Area 1-2 Recreational Recreational catch estimates for the month of July are not expected until next week. Table 2: Estimated Area 1-2 Recreational Catch to the end of June 2015 Month May June May June % of total catch by source Note: Season Catch By Species Area Coho Chinook Pink Sockeye Chum Rockfish 1 40 500 5 1 5 150 2E 0 400 0 0 0 0 2W 20 100 0 0 5 250 May Total 60 1000 5 1 10 400 1 1800 8200 50 20 80 1900 2E 0 150 0 0 0 100 2W 700 3200 60 0 10 3400 June Total 2500 11550 110 20 90 5400 1 1840 8700 55 21 85 2050 2E 0 550 0 0 0 100 2W 720 3300 60 0 15 3650 Season Total: 2560 12550 115 21 100 5800 Log Book 88% 86% 98% 86% 98% 95% Creel 7% 8% 0% 0% 0% 2% Estimate 4% 5% 2% 14% 2% 3% Catch estimates are preliminary and subject to change. Data sources include Logbook program from fishing lodges, Haida Creel and anecdotal information Halibut 150 200 100 450 3400 300 1500 5200 3550 500 1600 Lingcod 75 0 125 200 1300 50 1600 2950 1375 50 1725 5650 82% 7% 11% 3150 92% 3% 5% Figure 3: Catch and releases of Coho and Chinook in Area 1. Figure from Haida Fisheries Program June Creel Report. North Coast Salmon Update Page 4 of 15 Southeast Alaska Troll Regional coho CPUEs are above the 20-year average, though effort is below average. Southeast Alaska Southern Inside Troll Coho Catch per Boat-Day Tree Point Gill Net Fishery The Tree Point gill net fishery in Alaska was opened for4 days of fishing this week, opening Sunday, August 2nd at noon and to close at noon on Thursday, August 5th. No catch estimates were available for this opening at the time of posting. Catch estimates for the previous week (Week 31) for the Tree Point gill net fishery are listed below. Week 31 gill net (July 26 – August 1) harvests for 40 vessels over 4 days fishing: Chinook Sockeye Coho Pink Chum 40 2,000 660 25,000 70,000 Noyes Island Seine Fishery The District 4 seine fishery opened for 39 hours this week, from 05:00 Monday, August 3rd to 20:00 on August 4th. No catch estimates for this opening were available at time of posting. Catch estimates for the previous week (Week 31) are listed below. Week 31 SN harvests for 53 vessels: Chinook Sockeye Coho 0 75,000 13,000 North Coast Salmon Update Page 5 of 15 Pink Chum 570,000 34,000 Area 3 (Nass River) The Nass River fishwheels have been operating since June 4th. The current in-season total return to Canada (TRTC) forecast (50% confidence interval), based on mark-recapture data and mean run timing, increased from 559,000 last week to 567,000 (500,000 – 737,000) for data to August 2nd. This estimate assumes that 79% of the returning sockeye have migrated past the lower fish wheels at Gitwinksihlkw. The in-season run-size estimate past the Gitwinksihlkw fishwheels (GW), for data to August 2nd, is 293,927 sockeye, much higher than the 1994-2014 average of 211,000. The run-size target past the GW fishwheels is 250,000 sockeye. In addition, the point estimate for Nass chinook TRTC dropped slightly from 39,000 last week to 38,000 (36,000 – 41,000), based on mark-recapture data and mean run timing, and assuming that 95% of the returning stock has migrated past the GW fishwheels. The in-season run-size estimate past the GW fishwheels for upper Nass chinook , for data to August 2nd, is 26,355 fish, much higher than the 1994-2014 average of 19,800. The run-size target past the GW fishwheels is 15,000 chinook. Early indications of return strength to the Nass River are below average for coho, pink and chum salmon and above average for steelhead. At 2.2 meters, the Nass River water level at the GW fishwheels is 0.2 meters higher than the 1994 – 2014 average, while water temperature at the same location is 10.0oCelsius, which is 0.1oCelsius higher than the 1994 – 2014 average. http://www.pac.dfo-mpo.gc.ca/fm-gp/northcoast-cotenord/nass-eng.htm Nisga’a Fisheries Below is the estimated catch by Nisga’a harvest fisheries. To date, there have been 11 Nisga’a marine Individual Sales fisheries and 7 in-river Individual Sales fishery. Nisga’a Fisheries has announced that the next in-river IS opportunity will be August 5th. *From Nisga’a Fisheries North Coast Salmon Update Page 6 of 15 Commercial Net Fisheries: Twenty-one gillnet openings have occurred in Area 3. Further opportunities for later this week will be based on stock assessment information and will again be restricted in area to minimize interception of Skeena sockeye and Area 3 chum encounters, and operated under a nonpossession / non-retention regulation for chum and steelhead. Area 3 Gillnet Catch Estimates There have also been 13 seine opening to date, the last opportunities being Thursday July 30th and Friday’ July 31st to target Area 3 pinks and with retention of sockeye and coho. The fishery has been closed since due to poor pink abundance. Further opportunities will be based on pink abundance and will again be restricted in area to minimize interception of Skeena sockeye and Area 3 chum encounters, and operated under a non-possession / non-retention regulation for chum, chinook and steelhead. North Coast Salmon Update Page 7 of 15 Area 3 Seine Catch Estimates to July 31st: A catch monitoring program is in place for Area 3 net fisheries. Packer vessels and gillnet vessels landing to shore-based sites each have a 20% chance of being validated by an independent service provider. At-sea observers are now being deployed to the fleet to gather non-target species release information. Gillnet species composition from gill net validated landings Date Fished 09-Jun June 15/16 June 22/23 June 25/26 June 29/30 July 9/10 July 14/15 July 17/18 July 26/27 July 31/August 1 Sockeye Sockeye pieces % 459 2317 1702 2217 4209 8179 6806 7016 8,356 7,081 100 98.8 78.8 89.7 86.9 44 39.8 27.1 27.9% 37.2% Pink pieces Pink % 0 0 0 0 68 3.2 91 3.7 507 10.5 7953 42.8 8013 46.9 12618 48.7 20,745 69.4% 11,262 59.1% Chum pieces 0 0 0 0 0 2206 2041 5863 2 0 Chum % 0 0 0 0 0 11.9 11.9 22.6 0.0% 0.0% Coho pieces 0 4 292 114 24 220 203 403 770 690 Coho Chinook Chinook Steelhead % pieces % pieces 0 1.2 13.5 4.6 0.5 1.2 1.2 1.6 2.6% 3.6% 0 0 97 49 106 21 27 22 39 27 0 0 4.5 2 2.2 0.1 0.16 0.09 0.1% 0.1% Data provided by Ecotrust Canada Nass Inland Demonstration Fishery Both the Nisga’a and the Gitanyow are participating in inland demonstration fisheries to fish selectively for sockeye in the Nass watershed this year. The Nisga’a paused their harvesting from July 29-August 4 reduce impacts to Kwinageese sockeye. The Gitanyow began their harvest at the Meziadin site last week and are back fishing this week. Further sockeye allocations will be issued to both groups early next week, based on Area 3 marine commercial gillnet fishery catches. Sockeye allocations and Catches to date: First Nation # GN Licences Allocation Catch Nisga’a 45 3,690 3,081 Gitanyow 55 6,479 1,275 North Coast Salmon Update Page 8 of 15 0 0 0 0 0 0 0 0 0 0 Meziadin Fishway The Meziadin Fishway has been operational since July 1st. Current environmental conditions include water temperature of 15oCelsius, which is 1oCelcius below the mean, and water levels which are near normal at 1.24 meters. As of August 3rd, 58,784 adult sockeye (1994 – 2014 average to date is 72,400), 459 jack sockeye and 26 adult chinook have passed through the fishway. All of these counts are below the 1994 – 2014 average, to date. Historic and 2015 counts are available here: http://www.pac.dfo-mpo.gc.ca/fm-gp/northcoast-cotenord/meziadin-eng.htm Kwinageese Weir The Kwinageese weir is being managed by the Nisga’a Fish and Wildlife department, and has been operational since July 3rd. As of August 1st, a total of 265chinook and 11 sockeye had passed through the weir. Though sockeye counts are below the 1994 – 2014 average to date, chinook numbers are above average. No coho have been observed this year. Water levels and temperature are higher than normal for this time of year. According to the Nisga’a Fish and Wildlife Department, “The lower Kwinageese River barrier site was visited on March 3, 2015. Water levels were higher than normal due to early snow melt. The crew observed that several of the concrete blocks that were previously placed in the thalwag of the channel have since washed out. The concrete weir was still functioning by pooling water at the base of the bedrock barrier. Crew visited the barrier site on July 23 under normal water level and observed that the concrete weir structure was in the same condition as when visited in 2014. Numerous chinook were observed holding in the pool below barrier and a few were observed jumping the barrier.” Area 4 (Skeena River) The pre-season Skeena sockeye run size was for an above average return of 3.5 million (50% probability) with a 90% probability of 1.7 million and a 10% probability of 7.3 million, based on the sibling model. Based on the estimated escapement past the Tyee Test Fishery to August 3rd, and assuming average run timing, the current in-season point estimate (50% probability) for Total Return to Canada increased to 905,710, with a 90% probability of at least 661,559 and a 10% probability of 1.18 million. As a result, no Area 4 sockeye fisheries are anticipated at this time. The estimated Skeena sockeye escapement past the Tyee Test fishery, to August 3rd, is 710,926 fish. Assuming average run timing, approximately 79% of the sockeye return should have passed the Tyee Test Fishery by August 3rd. All species except sockeye and chinook are returning at, or above, historic decadal averages. Tyee test fishery data are available here: http://www-ops2.pac.dfo-mpo.gc.ca/xnet/content/salmon/testfish/sockeye/tyee_gillnet.htm North Coast Salmon Update Page 9 of 15 Tyee test fishery cumulative index to August 3rd: 2015 2000's Avg. 1990's Avg. 1980’s Avg. Sockeye 794.40 1470.88 917.77 1261.44 Coho 17.52 11.96 9.07 16.40 Pink 379.59 374.72 188.89 325.99 Chum 9.40 6.13 9.64 9.84 Lg Chinook 126.86 264.50 201.02 167.01 Steelhead 55.32 50.52 42.80 51.62 Historical and 2015 counts are available here: http://www.pac.dfo-mpo.gc.ca/fm-gp/northcoast-cotenord/index-eng.html Net Fisheries: One 18 hour gillnet opening occurred on June 12 and a second opening of 30 hours on June 27/28. Both openings were directed on Skeena chinooks and catches were below average for both openings. Given the poor escapement of Skeena sockeye, to date, no commercial net opportunities on Skeena sockeye are anticipated in Area 4 at this time. Area 4 Gillnet Catch Estimates Skeena Inland Demonstration Fishery The Lake Babine Nation and Gitxsan Watershed Authority have both expressed interest in participating in an inland demonstration fishery in the Skeena River watershed. Given the poor escapement of Skeena sockeye to date, no inland demonstration fisheries on Skeena sockeye are anticipated at this time. North Coast Salmon Update Page 10 of 15 Recreational Fisheries: The Area 3 and 4 marine creel survey began on June 1st. The preliminary data for estimated kept catch in June is listed below, along with historic June catch data (2009 – 2014) for comparison. Estimated Kept Catch by Year Species 2015 2014 2013 2012 2011 Chinook 7,262 6,142 5,241 2,504 7,076 Coho 4,902 2,126 5,883 427 922 Chum 8 Pink 16 Sockeye 6 Halibut 3,823 3,346 3,781 2,363 5,105 * Note that 2015 data is still preliminary 2010 3,903 4,486 2009 4,840 3,813 3,494 3,083 The lower Skeena River creel survey began on June 1st. July results should be available soon. Regular daily retention limits apply for salmon in the Skeena watershed, except for sockeye salmon, which has been varied to 1/day. Kitwanga Fence Preliminary update from the Gitanyow Fisheries Authority: The fence has been operational since July 10, which is the normal start date. The first chinook was counted on July 10th, with the total count of 160 as of the evening of July 29th. Assuming average run timing, ~14.7% of run has passed the fence by July 29th. The first sockeye was counted on July 14th, with a total count of 26 to the evening of July 29th. Assuming average run timing, ~2.8% of run should have passed through the fence by July 29th. A single pink salmon and no chum or coho have migrated have passed through the weir, to date. Typically, the first pink and chum salmon arrive during the first week of August and the first coho arrive around the middle of August. Water levels are currently ~0.87m, slightly higher than normal. Since the last update daily water temperatures have been fluctuating between 12-15°C. http://www.pac.dfo-mpo.gc.ca/fm-gp/northcoast-cotenord/index-eng.html Babine River Counting Facility The first fish was counted through the Babine River fence on July 14th. Current daily water temperature at the facility ranges from 14.0 – 14.2 Celsius, with water level increasing slightly to 80 cm on August 3rd. Total counts to date include 142,808 large sockeye, 2,941 jack sockeye, 15 chinook, 19 jack chinook and 197 pinks. On average, 19% of large sockeye should have passed North Coast Salmon Update Page 11 of 15 through the weir by August 3rd. In addition, to date, 7% of the jack sockeye return should have migrated past the fence. Water temperature at Fulton on August 2nd decreased to a range of 16.6 – 18.3oCelsius, and from 15.5 – 16.0oCelsius at Pinkut Creek. Historical and 2015 counts are available here (updated today or tomorrow): http://www.pac.dfo-mpo.gc.ca/fm-gp/northcoast-cotenord/index-eng.html Slamgeesh Weir The Gitksan Watershed Authorities will be operating the Slamgeesh weir again this year. It is typically operational in late July. Sustut Weir The Province of BC will be operating the Sustut weir again this year. It is typically operational in early August. Area 6 Net Fisheries: Area 6 seine openings have been poorly attended due to poor pink abundance and there is no catch to report. Patrolman surveys indicate pink abundance is well below the brood year abundance, to date. A catch monitoring program will be in place for the Area 6 seine fishery, should pink abundance increase enough to provide fishing opportunities. Due to adequate chum abundance in the Kitimat River area, a directed chum gillnet opportunity was provided on August 3rd, with a subsequent extension to August 4th based on catch information. Hail information from the initial opening indicated an estimated catch of 9,332 chum, 189 pinks and 7 chinook for 30 vessels. Releases included 51 sockeye and 50 coho. Area 7 Net Fisheries: The first net fishery was held on July 27th to assess abundance. The opening was not well attended (1 seine and 2 gill nets) and subsequently closed until further notice. Further openings for both gill nets and seines have since been announced for August 4th to assess abundance of local chums. North Coast Salmon Update Page 12 of 15 Area 7 Seine Catch Estimates to July 27th Recreational Fisheries: The data is currently incomplete for July, and it is hoped by next week all the July data from the lodges and charter operators will be received. Early indications from the data received for the weekly Chinook CPUE (catch per angler/angler day) continues to indicate it is similar to the past few years at 0.7 and slightly above the 10 year average of 0.6. Total known Chinook catch reported to-date is 2,085 for 3,242 angler days. Early indications from the data received for the weekly Coho CPUE is that it is down from the past few years and is down from the 10 year average. Total known Coho catch reported to-date is 1,309 for 3,242 angler days. Area 8 Net Fisheries: Area 8 opened to gill nets and seines on August 4th to target local chums. Preliminary hailed catches were not available at time of posting. To date, gillnets have harvested 1,205 sockeye, 7,075 pinks, 143,189 chums and 4,735 chinook. In addition, seines have harvested 300,490 pinks and 48,780 chum. Listed below are gill net and seine catch estimates, by opening, to July 28th. Area 8 Gillnet Catch Estimates to July 28th North Coast Salmon Update Page 13 of 15 Area 8 Seine Catch Estimates to July 28th Recreational Fisheries (Hakai Pass): There are 4 lodges operating in the Hakai Pass area this season. The opening dates are as follows: Joe’s Salmon Lodge - July 7th; Ole’s - July 14th; Hakai Lodge - July 15th and Hakai Land & Sea - July 20th. Indications from the data received for the weekly Chinook CPUE from July 5th to July 18th (Stat Weeks 28 & 29) is that it is above the past few years of 0.2 at currently sits at 0.4. Total Chinook catch reported to-date is 230 for 606 angler days. The weekly Coho CPUE is up from the past few years and significantly up from the 10 year average. Total Coho catch reported to-date is 695 for 606 angler days. Area 9 Recreational Fisheries: There may be up to 6 lodges operating in Rivers Inlet this season. The known opening dates are as follows: Duncanby - June 13th; Legacy - July 16th Sportsman’s Club - July 16th; Black Gold July 17th and Good Hope Cannery (private lodge) - July 22nd. At this time, it is unknown if Rivers Lodge will be operating this season. Thanks to the Wuikinuxv Guardian Watchmen (Brian Johnson, Patrick Johnson and Alex Chartrand Jr.) that participated in the Area 9 lodge site visits with DFO Central Coast staff on July 14th & 15th. For Stat Week 20 (July 12 to 18) the Chinook CPUE information indicates it is up from the past few years (2014-0.26 & 2013-0.15) at 0.53 and significantly up from the 10 year average of 0.19. Total Chinook catch reported to-date is 1,473 for 2,132 angler days. For Stat Week 20 (July 12 to 18) the Coho CPUE information indicates it is up from last year (0.31) at 1.20, down from 2013 (1.42) & 2012 (1.43), and well above the 10 year average of 0.52. Total Coho catch reported to-date is 1,699 for 2,132 angler days. North Coast Salmon Update Page 14 of 15 Area 10 The Docee weir became operational on July 1st. By July 30th, a total of 95,101 sockeye and 545 coho had migrated past the fence. This year’s Docee weir count can be found here: http://www.pac.dfo-mpo.gc.ca/fm-gp/northcoast-cotenord/index-eng.html For more information please visit the North Coast website here: http://www.pac.dfo-mpo.gc.ca/fm-gp/northcoast-cotenord/index-eng.htm North Coast Salmon Update Page 15 of 15
