June 17
advertisement
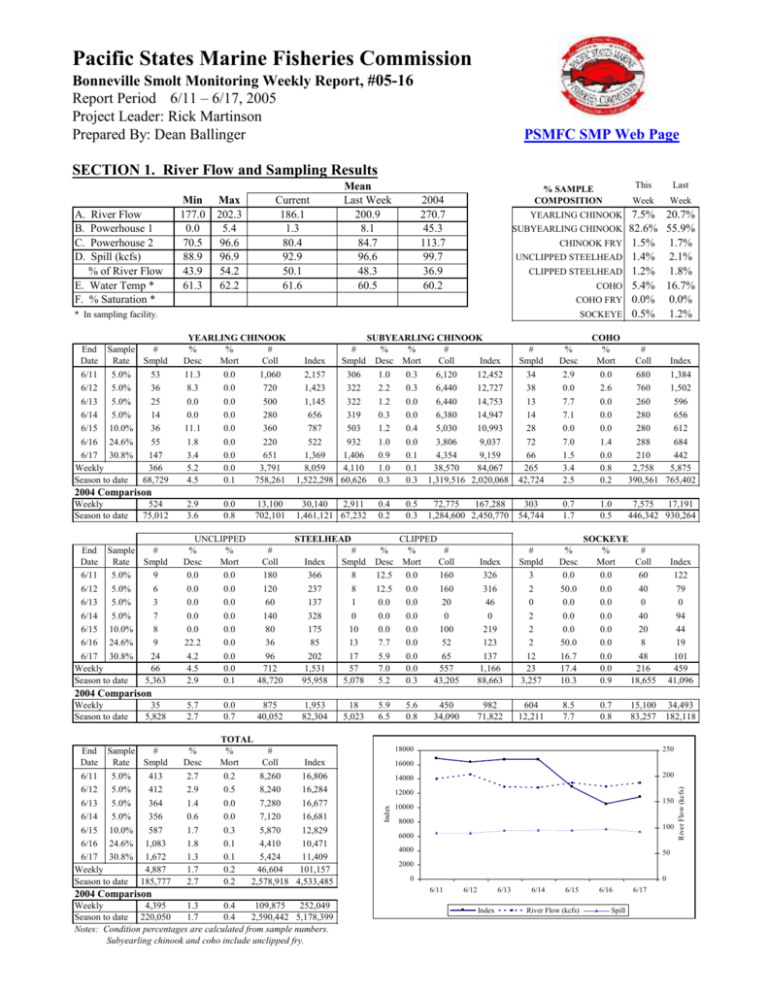
Pacific States Marine Fisheries Commission Bonneville Smolt Monitoring Weekly Report, #05-16 Report Period 6/11 – 6/17, 2005 Project Leader: Rick Martinson Prepared By: Dean Ballinger PSMFC SMP Web Page SECTION 1. River Flow and Sampling Results A. B. C. D. River Flow Powerhouse 1 Powerhouse 2 Spill (kcfs) % of River Flow E. Water Temp * F. % Saturation * Min 177.0 0.0 70.5 88.9 43.9 61.3 Max 202.3 5.4 96.6 96.9 54.2 62.2 Current 186.1 1.3 80.4 92.9 50.1 61.6 Mean Last Week 200.9 8.1 84.7 96.6 48.3 60.5 % SAMPLE COMPOSITION 2004 270.7 45.3 113.7 99.7 36.9 60.2 YEARLING CHINOOK SUBYEARLING CHINOOK CHINOOK FRY UNCLIPPED STEELHEAD CLIPPED STEELHEAD COHO COHO FRY * In sampling facility. End Sample # Date Rate Smpld 6/11 5.0% 53 6/12 5.0% 36 6/13 5.0% 25 6/14 5.0% 14 6/15 10.0% 36 6/16 24.6% 55 6/17 30.8% 147 Weekly 366 Season to date 68,729 SOCKEYE YEARLING CHINOOK % % # Desc Mort Coll 11.3 0.0 1,060 8.3 0.0 720 0.0 0.0 500 0.0 0.0 280 11.1 0.0 360 1.8 0.0 220 3.4 0.0 651 5.2 0.0 3,791 4.5 0.1 758,261 SUBYEARLING CHINOOK # % % # Index Smpld Desc Mort Coll Index 2,157 306 1.0 0.3 6,120 12,452 1,423 322 2.2 0.3 6,440 12,727 1,145 322 1.2 0.0 6,440 14,753 656 319 0.3 0.0 6,380 14,947 787 503 1.2 0.4 5,030 10,993 522 932 1.0 0.0 3,806 9,037 1,369 1,406 0.9 0.1 4,354 9,159 8,059 4,110 1.0 0.1 38,570 84,067 1,522,298 60,626 0.3 0.3 1,319,516 2,020,068 # Smpld 34 38 13 14 28 72 66 265 42,724 % Desc 2.9 0.0 7.7 7.1 0.0 7.0 1.5 3.4 2.5 30,140 2,911 1,461,121 67,232 303 54,744 0.7 1.7 % Desc 0.0 50.0 0.0 0.0 0.0 50.0 16.7 17.4 10.3 8.5 7.7 This Last Week Week 7.5% 20.7% 82.6% 55.9% 1.5% 1.7% 1.4% 2.1% 1.2% 1.8% 5.4% 16.7% 0.0% 0.0% 0.5% 1.2% COHO % # Mort Coll Index 0.0 680 1,384 2.6 760 1,502 0.0 260 596 0.0 280 656 0.0 280 612 1.4 288 684 0.0 210 442 0.8 2,758 5,875 0.2 390,561 765,402 2004 Comparison Weekly Season to date 524 75,012 End Sample # Date Rate Smpld 6/11 5.0% 9 6/12 5.0% 6 6/13 5.0% 3 6/14 5.0% 7 6/15 10.0% 8 6/16 24.6% 9 6/17 30.8% 24 Weekly 66 Season to date 5,363 2.9 3.6 0.0 0.8 UNCLIPPED % % Desc Mort 0.0 0.0 0.0 0.0 0.0 0.0 0.0 0.0 0.0 0.0 22.2 0.0 4.2 0.0 4.5 0.0 2.9 0.1 13,100 702,101 0.4 0.2 0.5 0.3 72,775 167,288 1,284,600 2,450,770 STEELHEAD # Coll 180 120 60 140 80 36 96 712 48,720 875 40,052 Index 366 237 137 328 175 85 202 1,531 95,958 CLIPPED # % % # Smpld Desc Mort Coll 8 12.5 0.0 160 8 12.5 0.0 160 1 0.0 0.0 20 0 0.0 0.0 0 10 0.0 0.0 100 13 7.7 0.0 52 17 5.9 0.0 65 57 7.0 0.0 557 5,078 5.2 0.3 43,205 Index 326 316 46 0 219 123 137 1,166 88,663 # Smpld 3 2 0 2 2 2 12 23 3,257 1,953 82,304 18 5,023 982 71,822 604 12,211 1.0 0.5 7,575 17,191 446,342 930,264 SOCKEYE % # Mort Coll 0.0 60 0.0 40 0.0 0 0.0 40 0.0 20 0.0 8 0.0 48 0.0 216 0.9 18,655 Index 122 79 0 94 44 19 101 459 41,096 2004 Comparison End Sample # Date Rate Smpld 6/11 5.0% 413 6/12 5.0% 412 6/13 5.0% 364 6/14 5.0% 356 6/15 10.0% 587 6/16 24.6% 1,083 6/17 30.8% 1,672 Weekly 4,887 Season to date 185,777 5.7 2.7 % Desc 2.7 2.9 1.4 0.6 1.7 1.8 1.3 1.7 2.7 0.0 0.7 TOTAL % # Mort Coll Index 0.2 8,260 16,806 0.5 8,240 16,284 0.0 7,280 16,677 0.0 7,120 16,681 0.3 5,870 12,829 0.1 4,410 10,471 0.1 5,424 11,409 0.2 46,604 101,157 0.2 2,578,918 4,533,485 2004 Comparison Weekly 4,395 1.3 0.4 109,875 252,049 Season to date 220,050 1.7 0.4 2,590,442 5,178,399 Notes: Condition percentages are calculated from sample numbers. Subyearling chinook and coho include unclipped fry. 5.9 6.5 5.6 0.8 450 34,090 0.7 0.8 15,100 83,257 18000 34,493 182,118 250 16000 200 14000 12000 150 10000 8000 100 6000 4000 50 2000 0 0 6/11 6/12 6/13 Index 6/14 6/15 River Flow (kcfs) 6/16 Spill 6/17 River Flow (kcfs) 35 5,828 Index Weekly Season to date SECTION 2. Condition Monitoring Summary Yearling Chinook SAMPLE # 3-19% DESCALING >20% BODY INJURY EYE HEAD OP FIN BKD DISEASE COL FUNG POP EYE HEMORRHAGE BODY EYE FIN PARASITES COPEPOD LEECH TREMATODE BIRD PREDATION LAMPREY FISH end dates Subyearling Chinook This Week Last Week This Week 209 245 501 19.1% 12.2% 5.0% 6.2% 3.7% 2.0% 1.9% 1.2% 0.4% 0.5% 0.4% Unclipped Steelhead Last Week 95 4.2% Last Week 125 16.0% 1.6% 0.8% 4.5% 0.8% 1.1% 1.2% 0.2% This Week 22 13.6% 9.1% Clipped Steelhead This Week 21 33.3% 4.8% 4.8% Last Week 129 36.4% 4.7% 2.3% 0.8% Coho Sockeye This Week Last Week This Week Last Week 130 208 6 95 13.8% 9.6% 25.3% 2.3% 3.4% 33.3% 10.5% 0.8% 2.3% 0.8% 1.5% 0.8% 20.2% 3.1% 2.1% 1.1% 1.1% 0.8% 1.4% 0.5% 6/17 18.2% 0.4% 6/10 1.6% 7.2% 23.8% Carp Chiselmouth 1.9% 2.1% 0.2% SECTION 3. Incidental Summary Adult Hatchery Steelhead This Week Season to Date Bass Smallmouth 1 10 Lamprey Lamprey Adult Juvenile Silver This Week 1 36 Season to Date 25 539 Smelt, Eulachon This Week Season to Date Bluegill and Pumpkinseed Stickleback 3 spine 2 1 127 Bullhead 4 1 Northern Pikeminnow Peamouth Sucker species 1 1 Sculpin species Sand Roller 1 229 5 Sucker Largescale 1 11 1 Shad Adult 2 21 2 Trout Cutthroat Trout Bull Chum Salmon Dace Speckled 1 7 60 Trout Rainbow 2 21 1 Kokanee 6 Shad Juvenile Shiner Redside 105 117 2 Whitefish Mountain Grand Total 154 4 1,194 SECTION 4. PIT Tag Summary Migration Year Chinook Coho 2003 2004 216 2005 17,913 Grand Total 18,129 Sockeye 2 686 688 Steelhead 21 21 6 51 6,915 6,972 Unknown Grand Total 6 6 6 269 25,541 25,816 SECTION 5. Facility Operations Debris was light at the primary dewatering structure (PDS) and fish/debris separator throughout the week consisting mostly of aquatic macrophytes. The Smolt Monitoring Facility remains in low outfall. Few birds have been observed around the outfall structures during most of the spring out-migration. No kelts were removed from the separator bars. Only one steelhead fallback was recorded crossing the separator bars this week. No Gas Bubble Trauma (GBT) symptoms were observed from continuing examinations this week. Please follow this link http://www.fpc.org/CurrentDaily/Gbtsum.txt) to the FPC web page for seasonal results. For other interesting information please see our PSMFC SMP web page (see link at top of page one) which includes links to past weekly reports, annual reports, and field guide pictures. The shift to subyearling chinook continued this week, going from 55% last week to 83% of the sample this week . Of those, 20% to 35% met the USGS (≥10 grams) and NOAA Fisheries ( ≥100mm) tagging criteria. SECTION 6. Research Approximately 335 and 262 subyearling chinook were held for USGS and NMFS research projects, respectively this week.
