Ellis Pond Productivity Lab - Mercer Island School District
advertisement
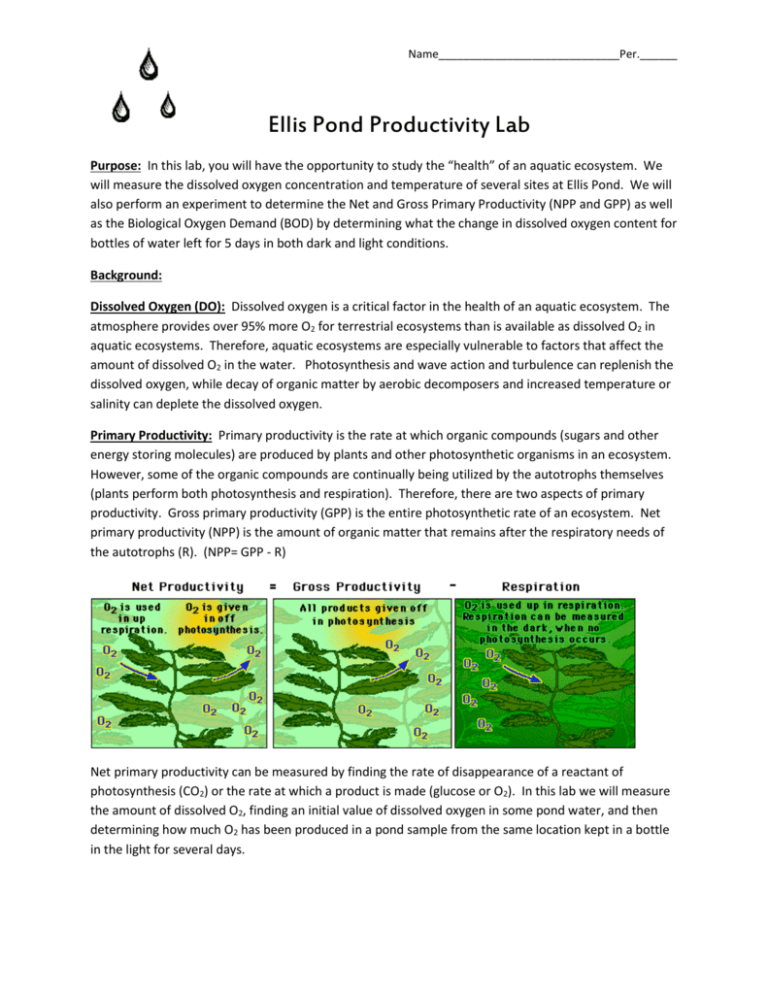
Name_____________________________Per.______ Ellis Pond Productivity Lab Purpose: In this lab, you will have the opportunity to study the “health” of an aquatic ecosystem. We will measure the dissolved oxygen concentration and temperature of several sites at Ellis Pond. We will also perform an experiment to determine the Net and Gross Primary Productivity (NPP and GPP) as well as the Biological Oxygen Demand (BOD) by determining what the change in dissolved oxygen content for bottles of water left for 5 days in both dark and light conditions. Background: Dissolved Oxygen (DO): Dissolved oxygen is a critical factor in the health of an aquatic ecosystem. The atmosphere provides over 95% more O2 for terrestrial ecosystems than is available as dissolved O2 in aquatic ecosystems. Therefore, aquatic ecosystems are especially vulnerable to factors that affect the amount of dissolved O2 in the water. Photosynthesis and wave action and turbulence can replenish the dissolved oxygen, while decay of organic matter by aerobic decomposers and increased temperature or salinity can deplete the dissolved oxygen. Primary Productivity: Primary productivity is the rate at which organic compounds (sugars and other energy storing molecules) are produced by plants and other photosynthetic organisms in an ecosystem. However, some of the organic compounds are continually being utilized by the autotrophs themselves (plants perform both photosynthesis and respiration). Therefore, there are two aspects of primary productivity. Gross primary productivity (GPP) is the entire photosynthetic rate of an ecosystem. Net primary productivity (NPP) is the amount of organic matter that remains after the respiratory needs of the autotrophs (R). (NPP= GPP - R) Net primary productivity can be measured by finding the rate of disappearance of a reactant of photosynthesis (CO2) or the rate at which a product is made (glucose or O2). In this lab we will measure the amount of dissolved O2, finding an initial value of dissolved oxygen in some pond water, and then determining how much O2 has been produced in a pond sample from the same location kept in a bottle in the light for several days. Since photosynthesis and respiration occur simultaneously, it is difficult to directly measure the GPP. We will indirectly measure this value by finding the respiration rate of a water sample that is kept in the dark (foil covered bottle). Since photosynthesis cannot occur in this sample bottle in the dark, the decrease in dissolved oxygen will indicate the rate at which respiration is occurring. Eutrophication and Biological Oxygen Demand (BOD): Eutrophication is an increase in the nutrient content of a lake. The source of the nutrients can be runoff of excess fertilizers (N or P) into the waters. Since nitrogen and phosphorous compounds are often limiting nutrients, an increase in their concentrations can result in an algal bloom, since these rstrategists can grow quickly when these nutrients are introduced. However, this fast growing species is also short-lived so there is an increase in decomposition resulting in increased consumption of O2 by aerobic decomposers. Eutrophication can also be caused by sewage and other organic waste entering an aquatic ecosystem, which will likewise be decomposed. Both algal blooms produced by an increased nutrient content and organic waste cause a greater utilization of oxygen by aerobic decomposers . Biological Oxygen Demand (BOD) is a measurement used to compare the degree of eutrophication in different bodies of water. It is the amount of oxygen consumed (per liter of water) in a sample kept in the dark for 5 days at 20 °C. A pristine lake typically has a BOD of 1 mg/L, while a moderately polluted river may have a BOD5 of 2-8 mg/L and untreated sewage may have BOD values in the 100’s mg/L. Pre-Lab Questions: 1. Write the overall formula for photosynthesis. 2. Explain 3 ways you could determine the rate of photosynthesis. (Use the formula above to determine changes that could be used to determine the rate.) 3. Write the overall formula for cellular respiration. 4. Define the following: Eutrophic: Oligotrophic: Gross Primary Productivity: Net Primary Productivity: Biological Oxygen Demand: 5. How does each of the following factors affect the level of dissolved oxygen in a water sample? Temperature: Photosynthetic Activity: Decomposition Activity: Mixing and Turbulence: Salinity: 6. Why could a high nitrogen or phosphorus level lead to a low level of dissolved oxygen? 7. Why is it important to slowly fill the sample bottles and fill them all the way to the top? 8. How will we determine the net primary productivity? 9. What is the purpose of the foiled wrapped bottle? 10. How will we determine the respiration rate for the sample? 11. How will we determine the gross primary productivity? Ellis Pond Littoral Zone Locations: Sketch on this picture areas that are shady, the main patches and types of vegetation (i.e. trees, bushes, grasses, etc.) Littoral = shoreline region in a freshwater lake or pond Note: Numbers represent water sample sites. Water sites #1-7 are all in the littoral zone of the lake. Materials to be taken to the pond (and returned!): ` Each Group: Share between groups: 2 BOD bottles DO kits 1 meter stick protocols for kits 1 thermometer* labs + pencils LabQuest with light and temperature probes* General supplies: tape, sharpies aluminum foil bag for disposing used ampules paper towels/hand sanitizer safety goggles 1st aid kit Procedures: 1. For your two BOD bottles, label them with the following information your names • sample site # • your period # the date • whether it is a “light” bottle or a “dark” bottle 2. At the study site, collect your samples of water for testing. Follow the written instructions in the Water Protocol Packet to test your water sample for DO, Record results in the data chart. 3. Collect BOD samples from your group’s sampling area. You will need to fill two (2) BOD bottles completely (no air in containers!) and cap them at the site. Wipe off the bottles, and immediately cover the one labeled “dark” with aluminum foil. Put an addition label with your names, sample site, and period on the outside of the foil. (Be sure there is both a label on the bottle and on the foil so that you can identify it class, but also know whether it was the light or dark bottle once the foil is removed.) 4. Use a LabQuest to measure the light intensity and water temperature at your sample site. Also, use the meter stick to determine the depth of the water just offshore where you are taking your samples. 5. Describe your site visually: water color, clarity, visible life (plant, insect, other?), proximity to trees/other light blocking vegetation, etc. Be as detailed as possible. 6. Sketch on the map areas of the lake that are relatively shady, sunny, etc., and the main patches of vegetation (along with a descriptor like trees, bushes, grasses, etc.). 7. Before leaving the lake, show the teacher your test kit(s) with all materials returned; your 2 capped BOD bottles, your thermometer, and meter stick. Once all groups have been cleared, you may return to MIHS. 8. Upon returning to class, place your BOD bottles under the lights on the light table. 9. In a later class we will test the DO in all of our BOD bottles, and record those values below. We will then calculate the GPP, NPP and R for all the zones of Ellis Pond. Data: Sample Site ____________________ Visual description of site (location, tree cover, water color etc.): Data collected on site: Zone Littoral (shore) 1 Littoral (shore) 2 Littoral (shore) 3 Littoral (shore) 4 Littoral (shore) 5 Littoral (shore) 6 Littoral (shore) 7 Littoral (shore) 8 DO (ppm) Temperature (°C) Light Depth(m) Data chart for part 2 (after bottles have been in the light or dark for approximately 5 days): Initial DO (ppm) Zone Littoral 1 Littoral 2 Littoral 3 Littoral 4 Littoral 5 Littoral 6 Littoral 7 Littoral 8 (From previous chart) Light Final DO (ppm) Dark Final DO (ppm) GPP NPP R Analysis and Extension Questions: 1. Do you think Ellis Pond is a healthy pond? Why or why not? The background information on DO, in the Water Protocol packet and the charts on p. 534-535 in your text may help you. Use the initial oxygen level (not the oxygen level after left in 24 hours of light for 5 days) to determine if the oxygen level is healthy. 2. Does the data allow you to determine the BOD of your zone of the lake? Explain your answer. If you can determine the BOD, state what the BOD value is and explain how you determined it. If you cannot determine the BOD, explain what changes you would need to make to your data collection. 3. Based on the dissolved oxygen levels, do predict that the pond is oligotrophic or eutrophic. Predict whether the nitrogen and phosphorus levels are high or low? Justify your answer. 4. Think about what time of day you collected your water samples. Would you expect the DO concentrations to be higher at 7 AM or at 5 PM? Explain your answer. 5. Would you expect the DO in water taken from a stream entering a lake to be higher or lower than the DO taken from the lake itself? Explain your answer. 6. A mammal uses only 1 to 2 percent of its energy in ventilation (breathing in and out) while a fish must expend about 15 percent of its energy to move water over its gills. Why is there this huge difference in their efforts to collect oxygen?
