Ecology and Characteristics of Life Study Guide
advertisement
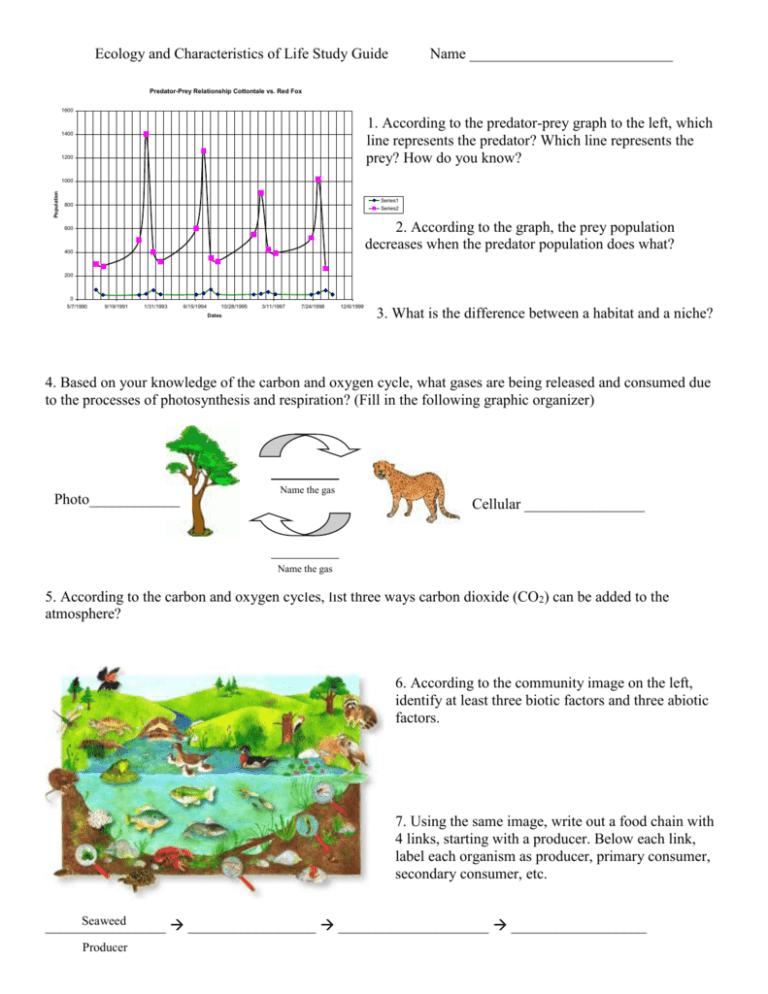
Ecology and Characteristics of Life Study Guide Name ___________________________ Predator-Prey Relationship Cottontale vs. Red Fox 1600 1. According to the predator-prey graph to the left, which line represents the predator? Which line represents the prey? How do you know? 1400 1200 Population 1000 Series1 800 Series2 2. According to the graph, the prey population decreases when the predator population does what? 600 400 200 0 5/7/1990 9/19/1991 1/31/1993 6/15/1994 10/28/1995 3/11/1997 7/24/1998 Dates 12/6/1999 3. What is the difference between a habitat and a niche? 4. Based on your knowledge of the carbon and oxygen cycle, what gases are being released and consumed due to the processes of photosynthesis and respiration? (Fill in the following graphic organizer) Photo____________ Name the gas Cellular ________________ Name the gas 5. According to the carbon and oxygen cycles, list three ways carbon dioxide (CO2) can be added to the atmosphere? 6. According to the community image on the left, identify at least three biotic factors and three abiotic factors. 7. Using the same image, write out a food chain with 4 links, starting with a producer. Below each link, label each organism as producer, primary consumer, secondary consumer, etc. Seaweed ________________ _________________ ____________________ __________________ Producer 8. Using your food chain, label the following energy pyramid to your left. 9. According to your energy pyramid, which level would the greatest amount of energy be found? Which level would the least amount of energy be found? 10. What is the main source of energy in an ecosystem? (Hint: what energy source do producers use to make food for themselves?) 11. Another name for producer is __________________. Another name for consumer is __________________. Another name for decomposer is ___________________. 12. Fill in the following table about symbiotic relationships: Symbiotic Relationship Definition A relationship where one organism benefits, while the other organism is harmed. Example Parasitism Lichen 13. In the diagram of the water cycle below, label precipitation, evaporation, condensation, and transpiration. 14. What is transpiration? 15. What is precipitation? 16. What is condensation? 17. Put the following levels of organization in order from smallest to biggest: ecosystem, biome, cell, atom, tissue, molecule, organ system, community, population, biosphere, organism 18. What is a biome? 19. What causes excess warming of the earth’s atmosphere? What is this effect called? 20. According to the nitrogen cycle, what is nitrogen fixation and what single organism is responsible for this process? 21. Why is nitrogen necessary for living organisms? 22. Label the climax stage in the diagram to the left. 23. Give an example of a pioneer species for primary succession. 24. How do these pioneer species contribute to the formation of a climax community? 25. Fill in the following Venn Diagram to Compare and Contrast primary from secondary succession. 26. In the following blank squares, draw what a clumped, uniform, random dispersion pattern looks like. Clumped Random Dispersion 27. What determines dispersion patterns? 28. In the blank graphs below, sketch what an exponential growth model and a logistical growth model look like. For the logistical growth model, label carrying capacity (k). To the right of the graphs in the box, jot down some notes or information about the characteristics of each of the growth models. Exponential Growth Model Logistical Growth Model 29. Define carrying capacity. 30. Name the six characteristics of life. 31. Define homeostasis and give an example of homeostasis.
