Study Guide for Final:
advertisement
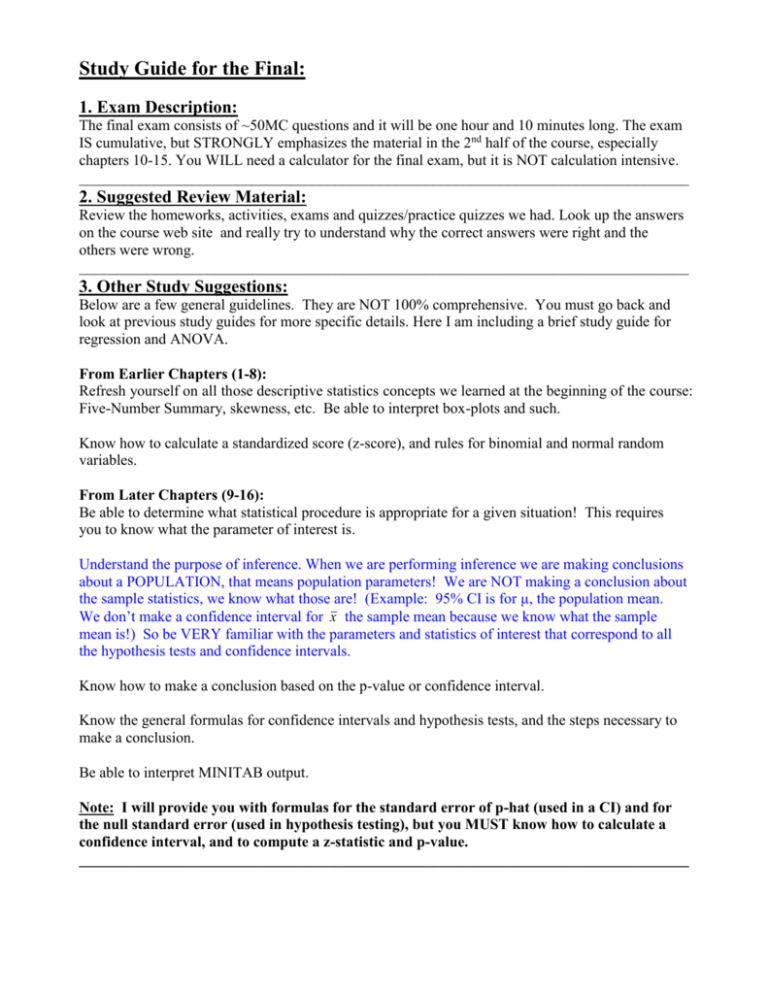
Study Guide for the Final: 1. Exam Description: The final exam consists of ~50MC questions and it will be one hour and 10 minutes long. The exam IS cumulative, but STRONGLY emphasizes the material in the 2nd half of the course, especially chapters 10-15. You WILL need a calculator for the final exam, but it is NOT calculation intensive. _________________________________________________________________________________ 2. Suggested Review Material: Review the homeworks, activities, exams and quizzes/practice quizzes we had. Look up the answers on the course web site and really try to understand why the correct answers were right and the others were wrong. _________________________________________________________________________________ 3. Other Study Suggestions: Below are a few general guidelines. They are NOT 100% comprehensive. You must go back and look at previous study guides for more specific details. Here I am including a brief study guide for regression and ANOVA. From Earlier Chapters (1-8): Refresh yourself on all those descriptive statistics concepts we learned at the beginning of the course: Five-Number Summary, skewness, etc. Be able to interpret box-plots and such. Know how to calculate a standardized score (z-score), and rules for binomial and normal random variables. From Later Chapters (9-16): Be able to determine what statistical procedure is appropriate for a given situation! This requires you to know what the parameter of interest is. Understand the purpose of inference. When we are performing inference we are making conclusions about a POPULATION, that means population parameters! We are NOT making a conclusion about the sample statistics, we know what those are! (Example: 95% CI is for µ, the population mean. We don’t make a confidence interval for x the sample mean because we know what the sample mean is!) So be VERY familiar with the parameters and statistics of interest that correspond to all the hypothesis tests and confidence intervals. Know how to make a conclusion based on the p-value or confidence interval. Know the general formulas for confidence intervals and hypothesis tests, and the steps necessary to make a conclusion. Be able to interpret MINITAB output. Note: I will provide you with formulas for the standard error of p-hat (used in a CI) and for the null standard error (used in hypothesis testing), but you MUST know how to calculate a confidence interval, and to compute a z-statistic and p-value. _________________________________________________________________________________ 4. Study Guides for Regression and ANOVA: Regression - Chapter 14: 1. You are not supposed to compute the regression line or test the hypothesis by hand. What you should know is how to read the Minitab output and also interpret it. 2. Be able to interpret a regression line, the slope and intercept. 3. Be able to interpret the correlation r, and R-squared (positive and negative association). 4. Write null and alternative hypotheses for a test of slope. 4. Know the conditions necessary for a simple linear regression to be valid. When does regression make sense? 5. Be able to use the regression equation to calculate the expected response if I give you the value of the predictor x. 6. Be able to understand MINITAB regression output! Be able to fill out possible missing values for the output, using the rest of the information. ANOVA Chapter 16.1: 1. When do we use ANOVA? ANOVA: is used to test for more than 2 means. (in chapter 13, we use 2-sample t test to test whether the two means are equal or not). H0: the population means for all different groups are all equal Ha: the population means for all different groups are not all equal 2. What are the conditions necessary for ANOVA? 3. Be able to interpret ANOVA output from MINITAB. I want ask you to calculate anything by hand, but you need to know how interpret the output. 5. Some final Summaries: Minitab Output: i. ii. iii. Be able to read the output for describing categorical variables. Be able to read the output for describing quantitative variables. Be able to read the output for tests and confidence intervals: a. b. c. d. e. 1-proportion z-test 1-sample t-test 2-proportion z-test 2-sample t-test paired t-test f. Chi-square test g. Regression analysis h. ANOVA Normal distribution: Normal distribution is symmetric, bell-shaped. Mean (denoted by ) and median are nearly the same. Standard deviation is denoted by σ. Compute probabilities for area under the normal curve. (these are P(Z2), P(Z2), P(-2<Z<2), and P(X<34), etc.). Compute percentiles, z-scores [z = (x - ) / σ ], be able to use the z-tables. If the necessary conditions are valid the sampling distribution of the sample mean (sample proportion) is normal, with mean μ (p), and standard deviation n ( p(1 p) n ). See Chapter 9 material and the solution of Prob. 1 in Mid-term 2. Statistical Inference: Testing: i. ii. iii. iv. v. vi. vii. Null and Alternative Hypotheses (and notation used) Types of errors (type 1 and type 2--definitions and interpretations) Level of significance (small probability, commonly denoted by with values .10, .05, .01, etc.) p-value: probability of getting the value of the sample statistic or something more extreme. Calculated, in most cases, as the area under a curve -- in the left tail or right tail or both, of the distribution. Statistically significant result: null hypothesis is rejected Purpose of a statistical test: to decide between two competing hypotheses about the population parameter Statistical tests: see 'Summary Table of Statistical Techniques'. Estimation: i. ii. iii. We use statistics to 'estimate' parameters Standard error of a statistic: an estimate of the variability of a statistic Confidence interval: an interval estimate for a parameter using our sample statistic and a given confidence level. General formula for a confidence interval: Sample estimate multiplier * standard error or Sample estimate margin of error iv. v. Confidence intervals can be used to test hypotheses with two-sided alternatives Understand the behavior of the margin of error and confidence intervals with changes in sample size, confidence level, and standard errors. ___________________________________________________________________________ 6. Formulas that are going to be provided: Percentile: x = (Stand. Deviation) * z + mean. For X binomial random variable with n trials and probability of success p: E(X) = np and s.d.(X) = np(1 p) s.d.( p̂ ) = p(1 p) n s.d.( x ) = , n Row total Column tot al (Obs. Exp.) 2 and df = (r-1)x(c-1) , where Expected Total sample size n Exp. all 2 cells n( AD BC ) 2 Special case for 2x2 tables: . R1 R2 C1C 2 2 Inference One Mean (1-sample t) Difference of two means (2-sample t) Parameter Statistic Standard Error s or µ or µd x or d µ1-µ2 x1 x 2 s12 s 2 2 n1 n2 p̂ pˆ (1 pˆ ) n One proportion P Difference of two proportions p1-p2 pˆ 1 pˆ 2 n sd n pˆ 1(1 pˆ 1) pˆ 2(1 pˆ 2) n1 n2 Multiplier t* Test Statistic t df=n-1 t* x 0 d 0 or t sd s n n t df=min(n1-1, n2-1) z z* z z* ( x1 x 2 ) 0 s1 2 s 2 2 n1 n 2 pˆ p0 p0 (1 p0 ) n pˆ 1 pˆ 2 n pˆ n2 pˆ 2 , pˆ 1 1 n1 n2 pˆ (1 pˆ ) pˆ (1 pˆ ) n1 n2

