Unit One Study Guide Homework
advertisement
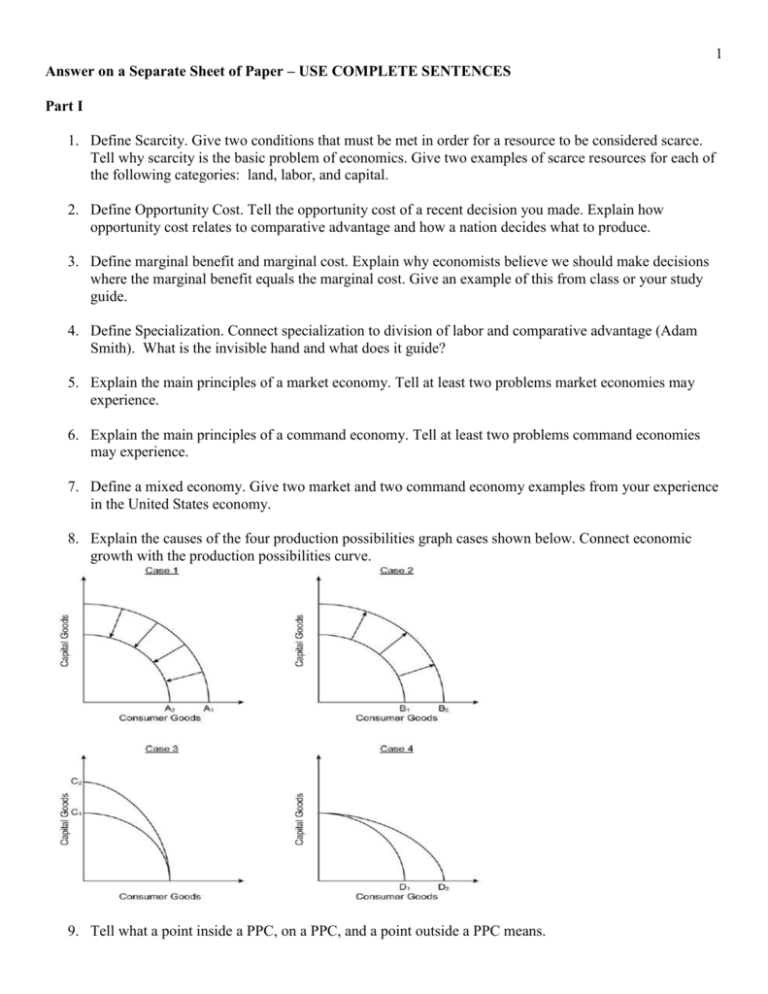
1 Answer on a Separate Sheet of Paper – USE COMPLETE SENTENCES Part I 1. Define Scarcity. Give two conditions that must be met in order for a resource to be considered scarce. Tell why scarcity is the basic problem of economics. Give two examples of scarce resources for each of the following categories: land, labor, and capital. 2. Define Opportunity Cost. Tell the opportunity cost of a recent decision you made. Explain how opportunity cost relates to comparative advantage and how a nation decides what to produce. 3. Define marginal benefit and marginal cost. Explain why economists believe we should make decisions where the marginal benefit equals the marginal cost. Give an example of this from class or your study guide. 4. Define Specialization. Connect specialization to division of labor and comparative advantage (Adam Smith). What is the invisible hand and what does it guide? 5. Explain the main principles of a market economy. Tell at least two problems market economies may experience. 6. Explain the main principles of a command economy. Tell at least two problems command economies may experience. 7. Define a mixed economy. Give two market and two command economy examples from your experience in the United States economy. 8. Explain the causes of the four production possibilities graph cases shown below. Connect economic growth with the production possibilities curve. 9. Tell what a point inside a PPC, on a PPC, and a point outside a PPC means. 2 10. Answer the four multiple choice questions below Part II 1. Define microeconomics. 2. Draw and label the circular flow diagram. Describe how economists use this model to explain the economy. Give an event that could occur in the product market and an event that could occur in the resource/factor market. 3. Describe the money payments made in the resource and product markets. Tell which function money serves in the resource and product markets. 4. Define supply, demand, law of supply, and law of demand. 5. Draw two graphs. On the first, graph a change in quantity demanded and, on the second, graph a change in demand. 3 6. Draw two graphs. On the first, graph a change in quantity supplied and, on the second, graph a change in supply. 7. Define market equilibrium. 8. List the determinants of supply. Give one market event that could increase supply and graph the change. Be sure to label Pe and P1 as well as Qe and Q1. 9. Give one market event that could decrease supply and graph the change. Be sure to label Pe and P1 as well as Qe and Q1. 10. List the determinants of demand. Give one market event that could increase demand and graph the change. Be sure to label Pe and P1 as well as Qe and Q1. 11. Give one market event that could decrease demand and graph the change. Be sure to label Pe and P1 as well as Qe and Q1. 12. Define and graph a price floor. Label the Qs and Qd. Tell whether there is a shortage or surplus. Give an example of a government price floor. 13. Define and graph a price ceiling. Label the Qs and Qd. Tell whether there is a shortage or surplus. Give an example of a government price ceiling. 14. Define price elasticity. Draw four demand curves. 1 – Perfectly elastic, 2 – Perfectly Inelastic, 3 – Relatively elastic, & 4 – Relatively Inelastic. 15. Define Business Organization. List the three types of business organizations and give the advantages and disadvantages of each. 16. Define market structure. List the four market structures. Draw a table showing the characteristics of each. 17. Answer the multiple choice questions below. 4 Part III 1. Define macroeconomics. Give three concepts we studied in our macroeconomics unit. 2. Define GDP. Give the components of the GDP Expenditure model. Explain the net exports component of GDP. List three transactions counted as investment spending in GDP. Give three transaction excluded from GDP calculations. 3. Define Inflation. List and define two indices used to measure inflation. Explain how each one is calculated. 5 4. Write a sample problem for CPI and then calculate the price index number. Tell the percent increase (or decrease) in prices compared to the base year. Tell what the PI always equals in the base year. 5. Define Aggregate Demand. Draw two graphs of the aggregate economy (AD/AS). On one, show an increase in AD, on the other, a decrease. Tell an event that could cause the shifts you graphed. Indicate on your graph, the changes in Price Level and Real GDP (output). 6. Define Aggregate Supply. Draw two graphs of the aggregate economy (AD/AS). On one, show an increase in AS, on the other, a decrease. Tell an event that could cause the shifts you graphed. Indicate on your graph, the changes in Price Level and Real GDP (output). 7. Explain the relationship between changes in Real GDP (output) on your graph and unemployment. 8. Define recession and depression. Identify and define the specific type of unemployment these conditions cause. 9. Define unemployment (be sure to emphasize WHO is considered unemployed). Explain the concept of a discouraged worker. Define the two remaining types of unemployment in the economy. 10. Shift in AD and AS can be used to show inflation. Graph demand pull and cost push inflation on an AD/AS graph. Define stagflation and indicate which of your graphs illustrates this condition. 11. Define Budget Deficit and National Debt. Tell why it may be bad for a government to carry a large national debt. 12. Define Federal Reserve System. Give the three main functions of the Federal Reserve Bank and the duties that fall under these functions. 13. List the three tools of monetary policy conducted by the Fed. Describe the three actions using these tools that would expand the economy (increase money supply) and the three actions that would contract the economy (decrease the money supply). Tell how expansionary (loose) and contractionary (tight) monetary policy will affect the AD curve. 14. List the two tools of fiscal policy conducted by the government. Describe the two actions using these tools that would expand the economy and the two actions that would contract the economy. Tell how expansionary and contractionary fiscal policy will affect the AD curve. 15. Answer the multiple choice questions below. 6 7 International EOCT Study Guide Questions Answer on a separate sheet of paper. 1. Describe the difference between absolute advantage and comparative advantage. Answer the following questions given the information in the chart below: a. Who has the absolute advantage in freezers? b. Who has the absolute advantage in dishwashers? c. Who has the comparative advantage in freezers and what is the opportunity cost of production? d. Who has the comparative advantage in dishwashers and what is the opportunity cost of production? 2. Compare and contrast the terms balance of trade and balance of payments. Give two transaction examples that would fall into the current account portion of the balance of payments and two transaction examples that would fall into the financial (formerly capital) account. Be sure to tell whether these transactions are debits or credits to the balance of payments. 3. Explain the concept of Trade Barriers. Tell one cost and one benefit of using trade barriers. List the five trade barriers discussed in your EOCT study guide. Give an example for each that illustrates how the barrier might be used by a nation. 4. Define Exchange Rate. Give two situations that could cause a nation’s currency to appreciate and two situations that could cause a nation’s currency to depreciate. Using the chart on page 56 in the EOCT guide, tell how many Euros are needed to buy one dollar. Using the same chart, tell how many dollars are required to purchase one British Pound. 5. Using your knowledge of exchange rates and trade, tell who gains and who loses from the depreciation of the dollar. Explain how this will affect our balance of trade, the current account balance, aggregate demand, and U.S. Real GDP. 6. Answer the multiple choice questions below. 8


