Physics Lab: Graphical Analysis of Motion
advertisement
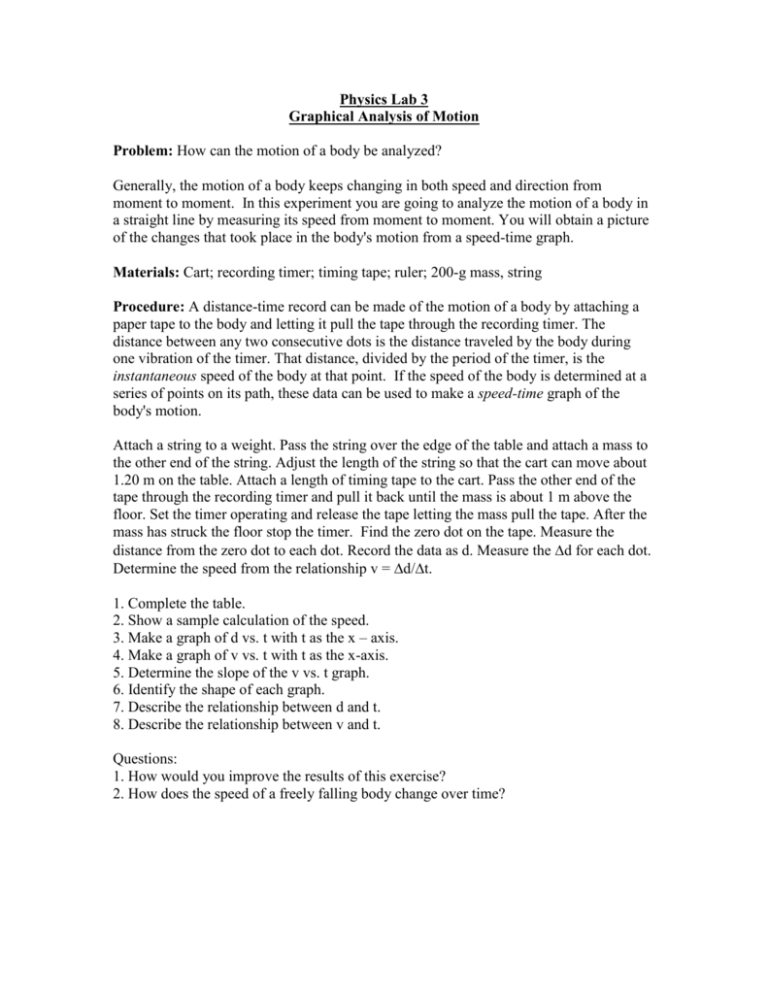
Physics Lab 3 Graphical Analysis of Motion Problem: How can the motion of a body be analyzed? Generally, the motion of a body keeps changing in both speed and direction from moment to moment. In this experiment you are going to analyze the motion of a body in a straight line by measuring its speed from moment to moment. You will obtain a picture of the changes that took place in the body's motion from a speed-time graph. Materials: Cart; recording timer; timing tape; ruler; 200-g mass, string Procedure: A distance-time record can be made of the motion of a body by attaching a paper tape to the body and letting it pull the tape through the recording timer. The distance between any two consecutive dots is the distance traveled by the body during one vibration of the timer. That distance, divided by the period of the timer, is the instantaneous speed of the body at that point. If the speed of the body is determined at a series of points on its path, these data can be used to make a speed-time graph of the body's motion. Attach a string to a weight. Pass the string over the edge of the table and attach a mass to the other end of the string. Adjust the length of the string so that the cart can move about 1.20 m on the table. Attach a length of timing tape to the cart. Pass the other end of the tape through the recording timer and pull it back until the mass is about 1 m above the floor. Set the timer operating and release the tape letting the mass pull the tape. After the mass has struck the floor stop the timer. Find the zero dot on the tape. Measure the distance from the zero dot to each dot. Record the data as d. Measure the d for each dot. Determine the speed from the relationship v = d/t. 1. Complete the table. 2. Show a sample calculation of the speed. 3. Make a graph of d vs. t with t as the x – axis. 4. Make a graph of v vs. t with t as the x-axis. 5. Determine the slope of the v vs. t graph. 6. Identify the shape of each graph. 7. Describe the relationship between d and t. 8. Describe the relationship between v and t. Questions: 1. How would you improve the results of this exercise? 2. How does the speed of a freely falling body change over time? DATA TABLE d (m) T (s) d (m) t (s) v (m/s)
