Bragg diffraction_manual mode
advertisement
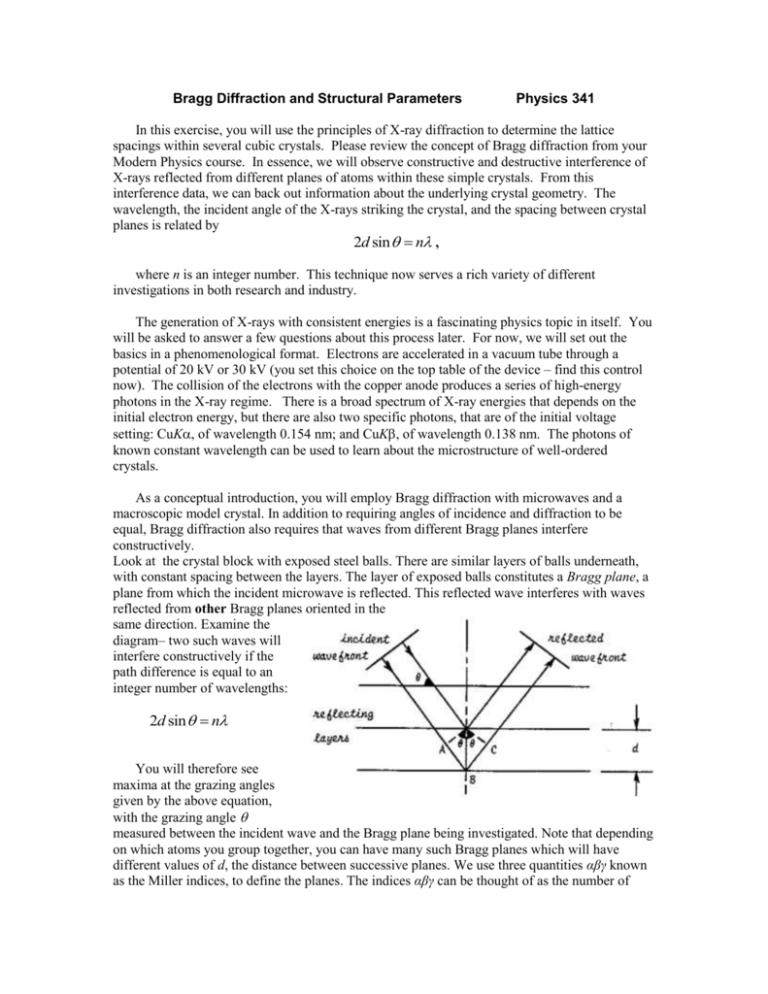
Bragg Diffraction and Structural Parameters Physics 341 In this exercise, you will use the principles of X-ray diffraction to determine the lattice spacings within several cubic crystals. Please review the concept of Bragg diffraction from your Modern Physics course. In essence, we will observe constructive and destructive interference of X-rays reflected from different planes of atoms within these simple crystals. From this interference data, we can back out information about the underlying crystal geometry. The wavelength, the incident angle of the X-rays striking the crystal, and the spacing between crystal planes is related by 2d sin n , where n is an integer number. This technique now serves a rich variety of different investigations in both research and industry. The generation of X-rays with consistent energies is a fascinating physics topic in itself. You will be asked to answer a few questions about this process later. For now, we will set out the basics in a phenomenological format. Electrons are accelerated in a vacuum tube through a potential of 20 kV or 30 kV (you set this choice on the top table of the device – find this control now). The collision of the electrons with the copper anode produces a series of high-energy photons in the X-ray regime. There is a broad spectrum of X-ray energies that depends on the initial electron energy, but there are also two specific photons, that are of the initial voltage setting: CuK, of wavelength 0.154 nm; and CuK, of wavelength 0.138 nm. The photons of known constant wavelength can be used to learn about the microstructure of well-ordered crystals. As a conceptual introduction, you will employ Bragg diffraction with microwaves and a macroscopic model crystal. In addition to requiring angles of incidence and diffraction to be equal, Bragg diffraction also requires that waves from different Bragg planes interfere constructively. Look at the crystal block with exposed steel balls. There are similar layers of balls underneath, with constant spacing between the layers. The layer of exposed balls constitutes a Bragg plane, a plane from which the incident microwave is reflected. This reflected wave interferes with waves reflected from other Bragg planes oriented in the same direction. Examine the diagram– two such waves will interfere constructively if the path difference is equal to an integer number of wavelengths: 2d sin n You will therefore see maxima at the grazing angles given by the above equation, with the grazing angle measured between the incident wave and the Bragg plane being investigated. Note that depending on which atoms you group together, you can have many such Bragg planes which will have different values of d, the distance between successive planes. We use three quantities αβγ known as the Miller indices, to define the planes. The indices αβγ can be thought of as the number of steps in x, y, and z to reach the next atom in the same Bragg plane. In the picture below, the pencil represents a portion of a line on the Bragg plane that is perpendicular to the plane of the paper. Note that the above planes all have their normal (perpendicular) in the plane of the paper (no z-component). Here is a Bragg plane that has a z-component; its designation is 111: From geometry, the distance between adjacent planes is given by d s 2 2 2 , where s is the distance from one atom to its nearest neighbor in the cubic lattice. Microwave diffraction: The objective is to generate a plot of meter intensity vs. grazing angle, for two different Bragg planes. 1. Straighten the goniometer arms such that transmitter and receiver face each other directly; they will be at 0 and 180 degrees, respectively. 2. Put the rotating table on the goniometer and rotate it such that the angle indicator reads 0 degrees. Note that you will be recording grazing angles, not angles of incidence or reflection. Luckily the grazing angle is simply the complement of the incident angle. 3. Place the “crystal” on the rotating table in the center of the goniometer. Carefully open the top layer of Styrofoam crystal and observe the steel “atoms” within. Identify the 100 Bragg plane and orient the crystal such that the plane is initially parallel to both goniometer arms. Use a caliper to measure the atomic spacing, d, between the Bragg planes, and replace the top of the “crystal”. 4. Plug in the microwave detector and set the gain to “9.” The detection of microwaves here will appear as an output current that can be read on the top of the instrument. Remember the detector arm should be exactly opposite the microwave source, at 180o. Plug in the microwave source and set it at 0 degrees. 5. Turn the rotating table (and hence the crystal) 2 degrees clockwise and the movable goniometer arm 4 degrees clockwise. What you are doing here is maintaining the incident angle the same as the reflected angle, a condition necessary for Bragg diffraction. Now you will collect the data by slowly moving the crystal through various angles , and moving the detector to angles 2. 6. Take a measurement every 2.5o of crystal movement to a maximum angle of 45o (5o increments to 90o for the detector). For large signal changes you should take the data at closer intervals. I suggest you plot your data in Origin as you go along, so that you can fill in more data points if needed. 7. Plot your results in Origin and find the first major peak. Each peak corresponds to a maximum in the 2d sin m Bragg equation. Recall that higher order maxima have greater angles. Calculate the apparent wavelength of the microwaves and compare it to the specs of the manufacturer (frequency = 10.52 GHz, wavelength = 2.85 cm). 8. From your data in 7 and the frequency of the transmitter, calculate the experimental plane separation (averaging data from peak(s)) and compare with the theoretical separation d s 2 2 2 , where s is measured directly on the crystal with a caliper or ruler. 9. Repeat the steps above for the 110 Bragg plane. Collecting X-ray data: 1. Before using the Tel-X-Ometer, make sure you have gone over the operation of the device with your instructor. 2. Carefully mount the NaCl crystal in the central sample platform (this crystal has yellow paint on its end face). Make sure the more reflective surface is facing the beam. 3. Close the protective cover, center the hinge, and move the traveling detector arm to its minimum angle (circa 10 degrees). 4. Activate the Geiger tube (2546), the Ratemeter (2807 with the 2021 digital readout), and the X-ray source. NOTE: You must turn the key and let the system warm for at least 5 minutes before depressing the ON button to produce X-rays. 5. Now slowly change the value of 2 , recording values of counts at each angle. This is slow work, but you want to have a detailed spectrum for 2 values between 10 and 90 degrees. Note that the count values fluctuate. Record the observed high count rate, the observed low count rate, and the approximate average for each angle. 6. Deactivate the X-ray source by sliding the cover gently to the side. The vacuum tube should flash, and then grow dim. Make sure the count rate has dropped to near zero. 7. Open the cover, and carefully remove the NaCl crystal. 8. Repeat steps 2-7 for KCl crystal (green), and the RbCl crystal (red). Analysis: 1. To review a bit of Modern Physics, calculate the single photon energies for the K and the K photons. 2. In Origin, input your three spectra for the three crystals. 3. Use Bragg’s law to determine the lattice spacing for each crystal. 4. Which crystal shows the largest value of d? How can you make sense of this? (FYI: each crystal has the same simple cubic structure.) 5. Look at one spectrum. You should have a total of four clear peaks with a background hump at smaller angles. Consider the collision of high-energy electrons with copper, and try to explain the types of photons that could give you this spectrum. What mechanisms produced them?
